The Identification and representation of data in the Data sheet of Chart Properties should be an precise copy of the information shown in various type of charts. However, in some special cases there may be deviations especially for that that are not shown like time serie charts.
Especially the display of Frequence distributions of parameters or performance indicators for various ensemble have been problematic. The new version of today is corrected to display both correct values and also an Identification that should be easy to understand. Note that the unique x-axis representing parameters values in a distribution was only represented correctly for the first selected variable in previous versions. The current version should have a correct representation also of this idependent variable for each chart,
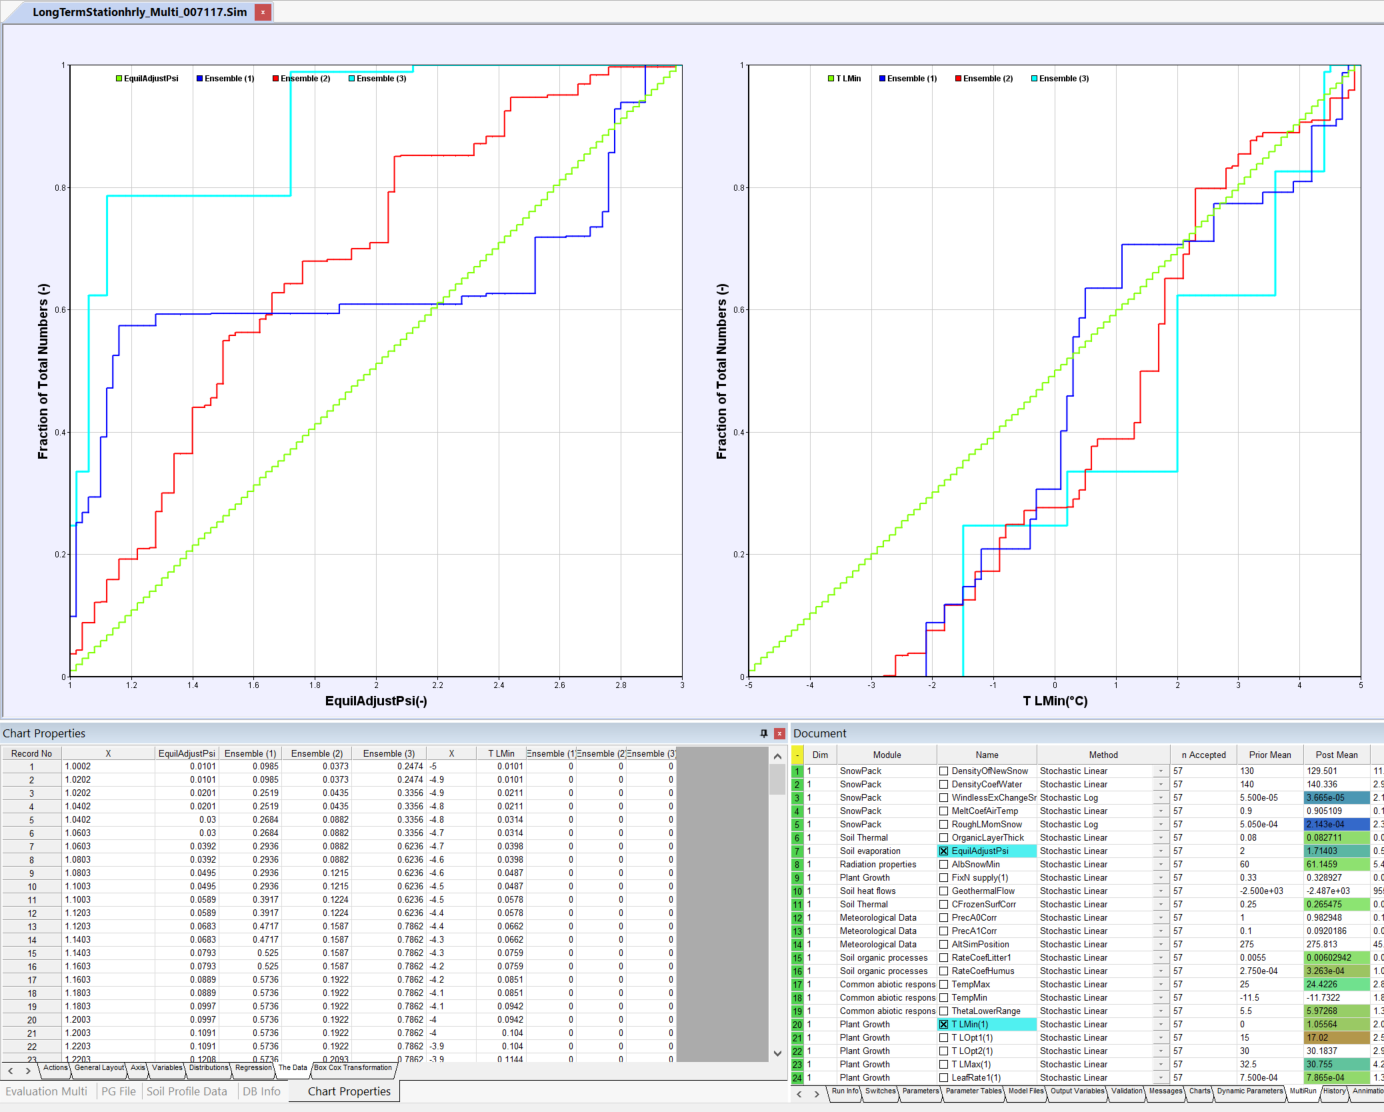
Note that the first column with the parameter name represent the prior distribution and the following Ensemble(1), (2) and (3) are posterior distribution for the same parameter but for ensembles that have been defined by different criteria’s.