The aggregation of time serie data for standard chart with a date/time axis has previously been forced to aggregation that corresponds to the resolution of your screen.
A typical results are the serie below with hourly radiation data for many years.
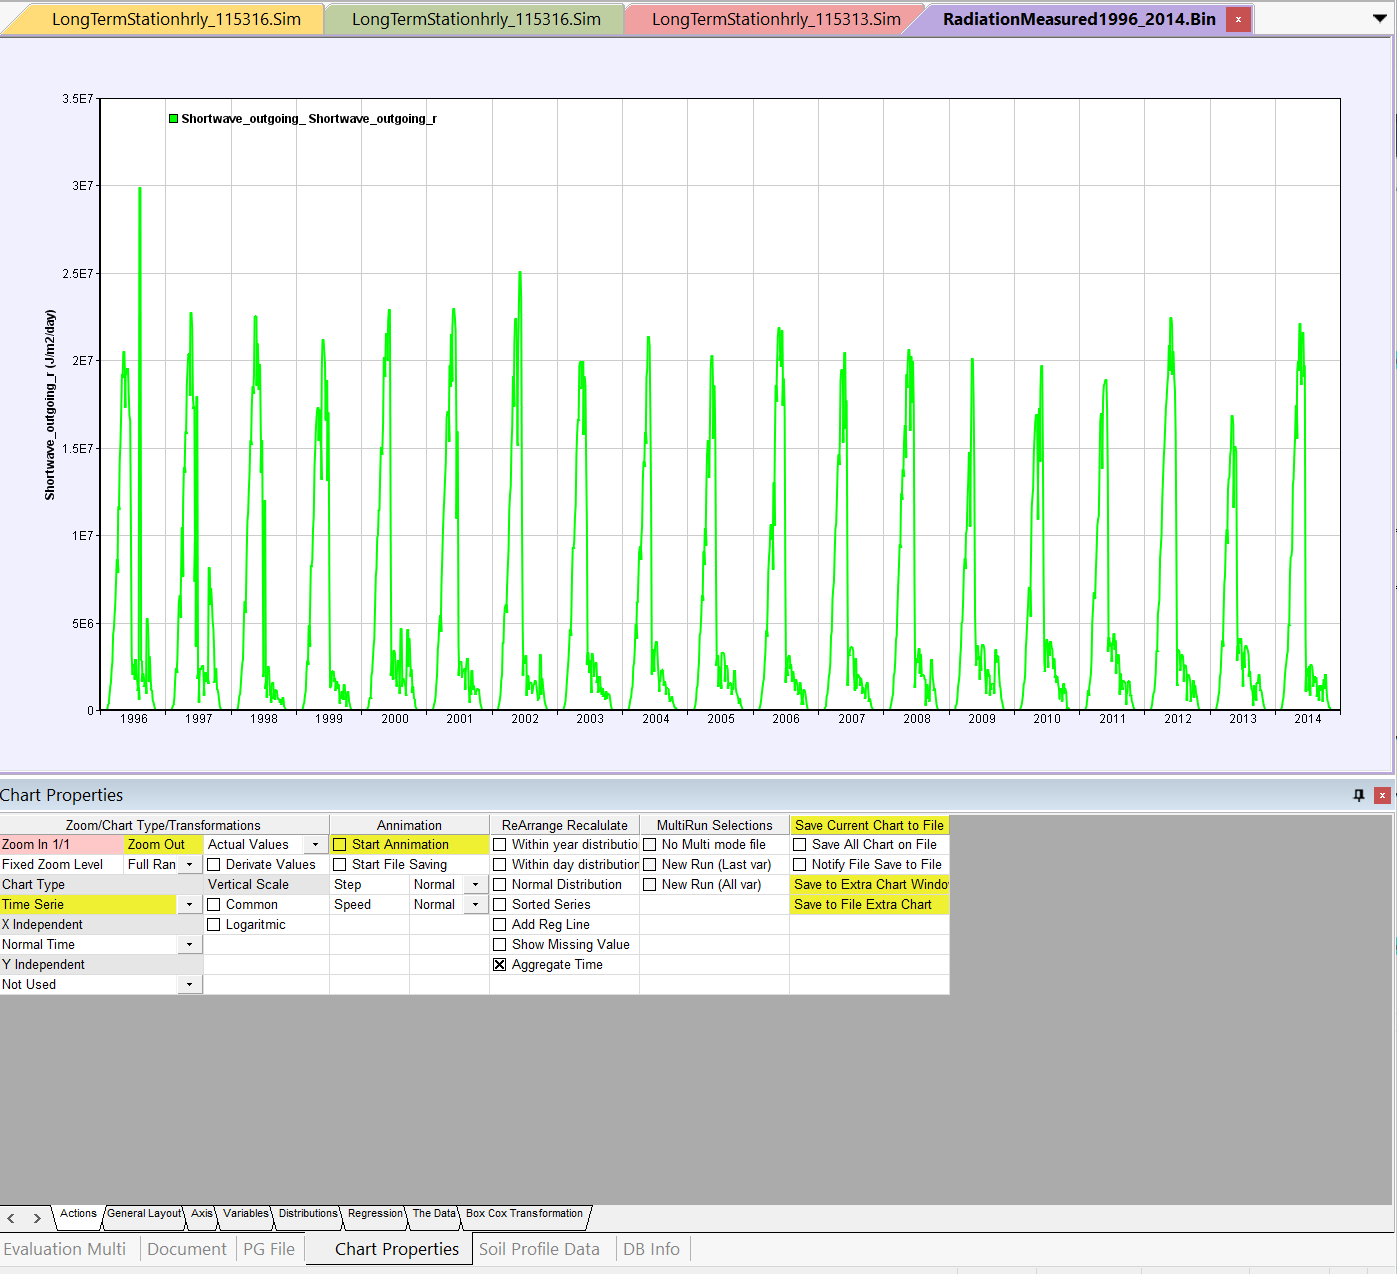
The ChartProperties window allow you to now remove the aggregation to show every single data point on your screen. This may be interesting for instance if you are interested to see the max and min values during the entire period.
See the results below:
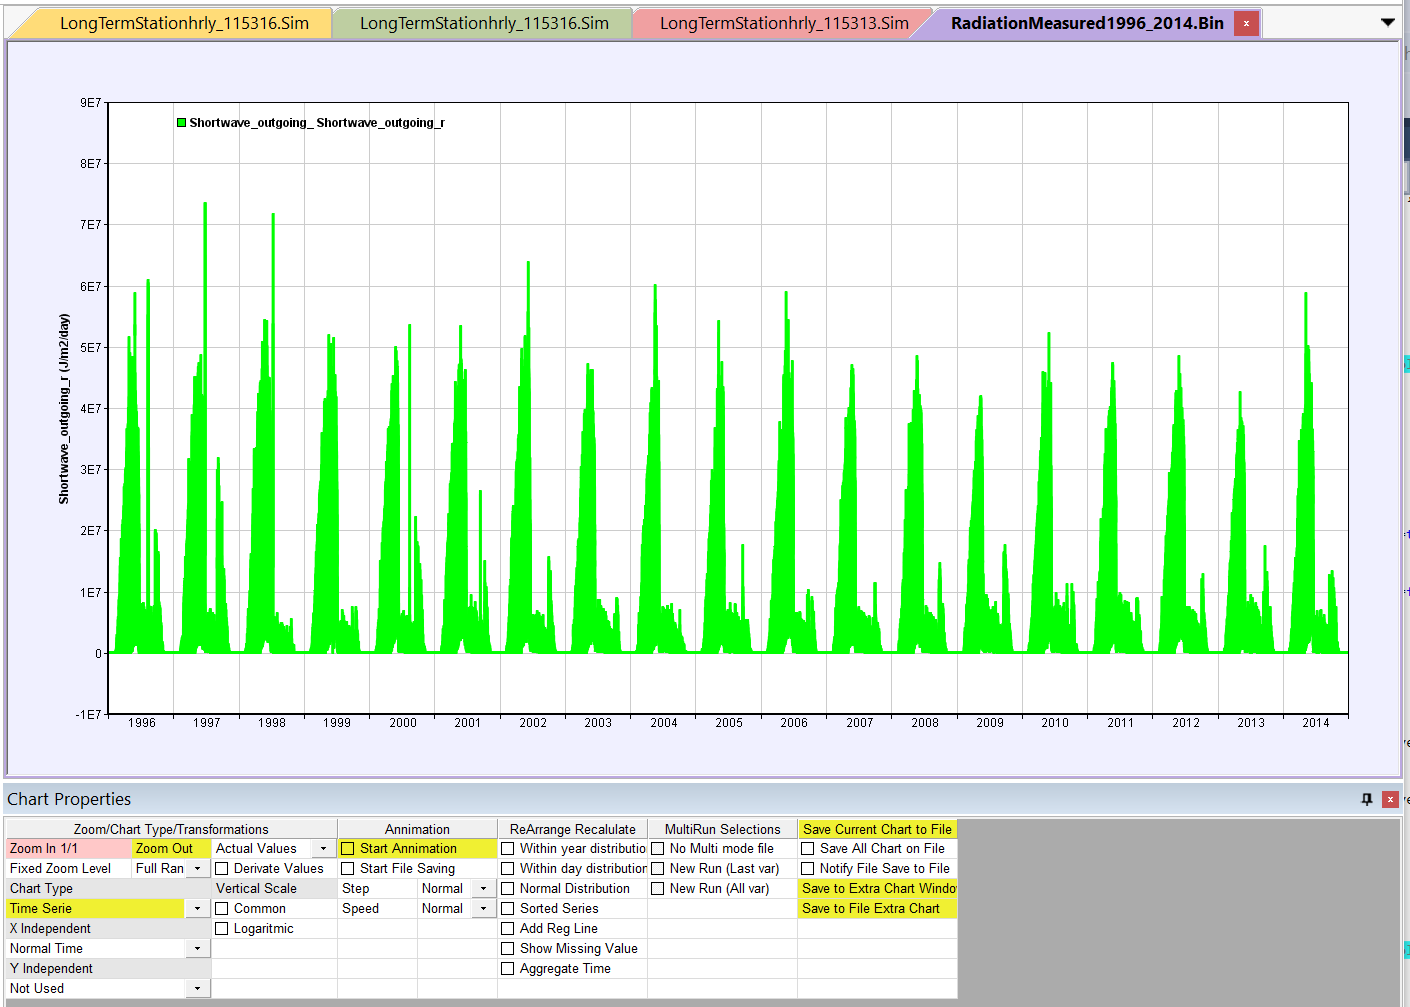
In addition to this the new version has fixed a bug so that the scale of the x-axis should now be able to be adjusted by manual settings.