To the Output sheet has a number of new options partly combined with ChartProperties window.
1) Then new additional description of all variables as belonging to a Process and Representing an Element
occupies one new column (similar to the Switches and Parameter sheets)
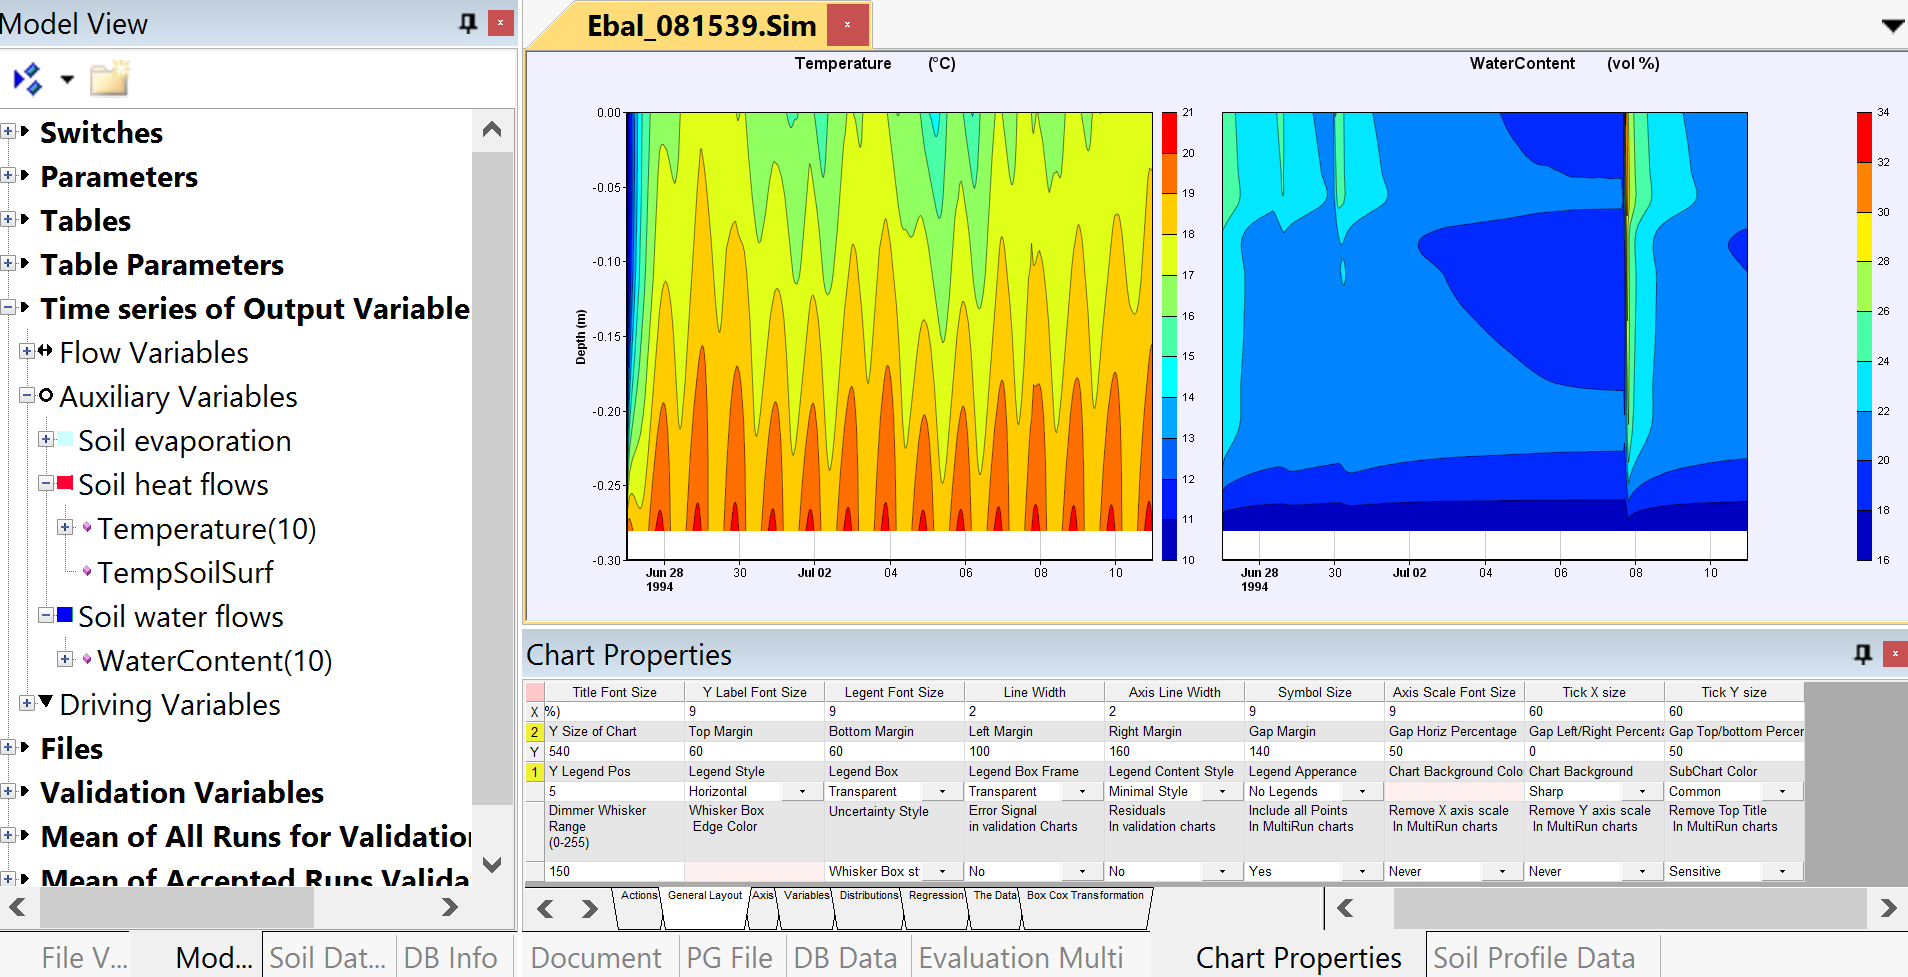
2) Viewing of depth related simulated variables by using the Contour Chart type is improved. Many depth related variables can be shown in different subcharts and having parallell common zooming features.
3) View of all time serie variables with new independent variables instead of normal time with date/hour axis.
In addition a number of bugs have been corrected in the previous 5.2.0 version.