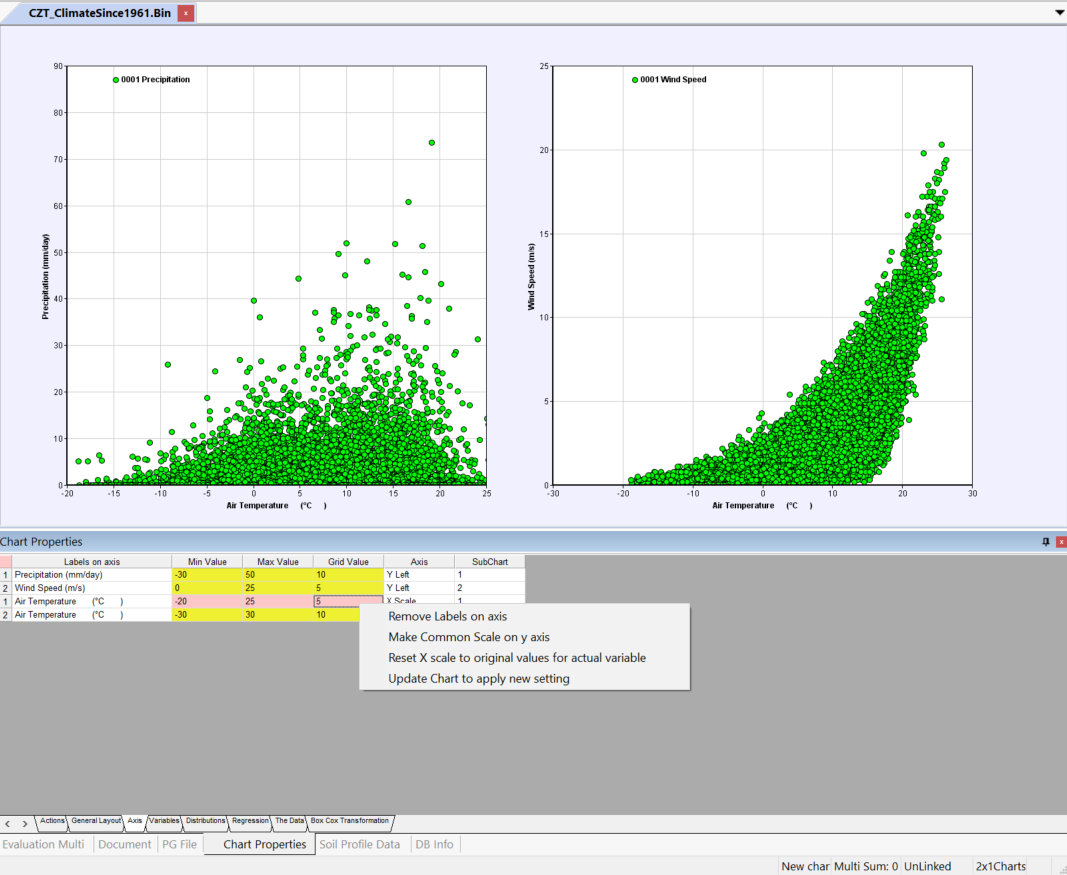
The axis sheet of the ChartProperties window will by the current version keep the setting for the chart until
a reset or a new change is made manually.
Previously the changes was always removed when new charts were made.
The values are indicated by yellow or red background colors as could be seen on the picture above.
Yellow indicate that values are default automatic settings and red are manually modified values.
By right click you will recieve the options available for your particular axis and variable. Note that some changes require an update
before the results will be shown in the drawing area.
Some additional bugs have been removed !
Download latest version if you want a more consitent behaviour of the program when making various charts.