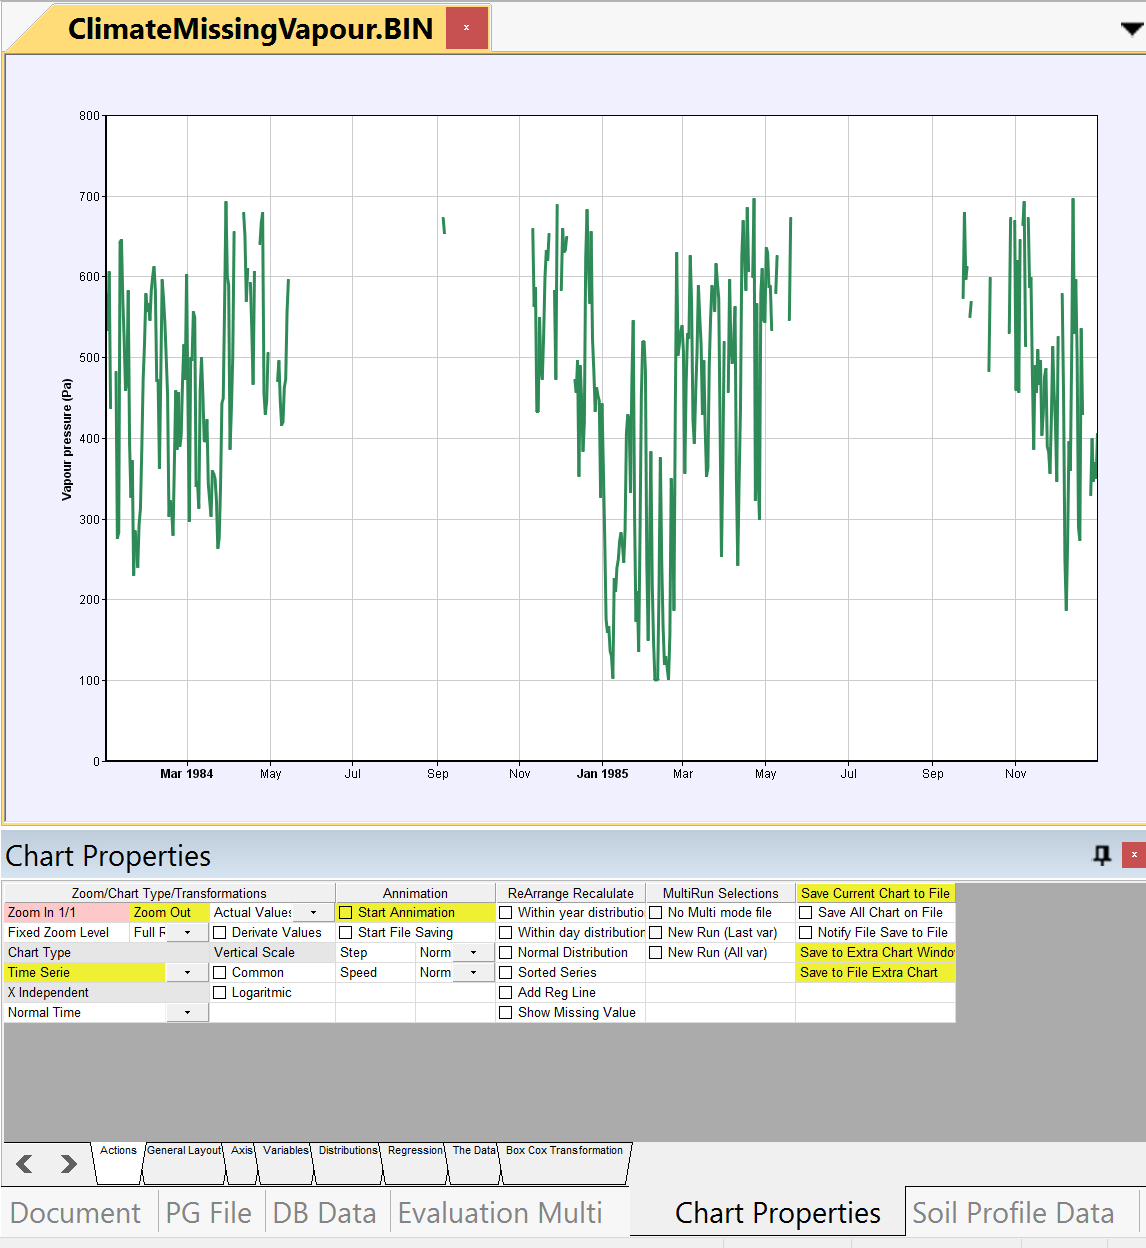
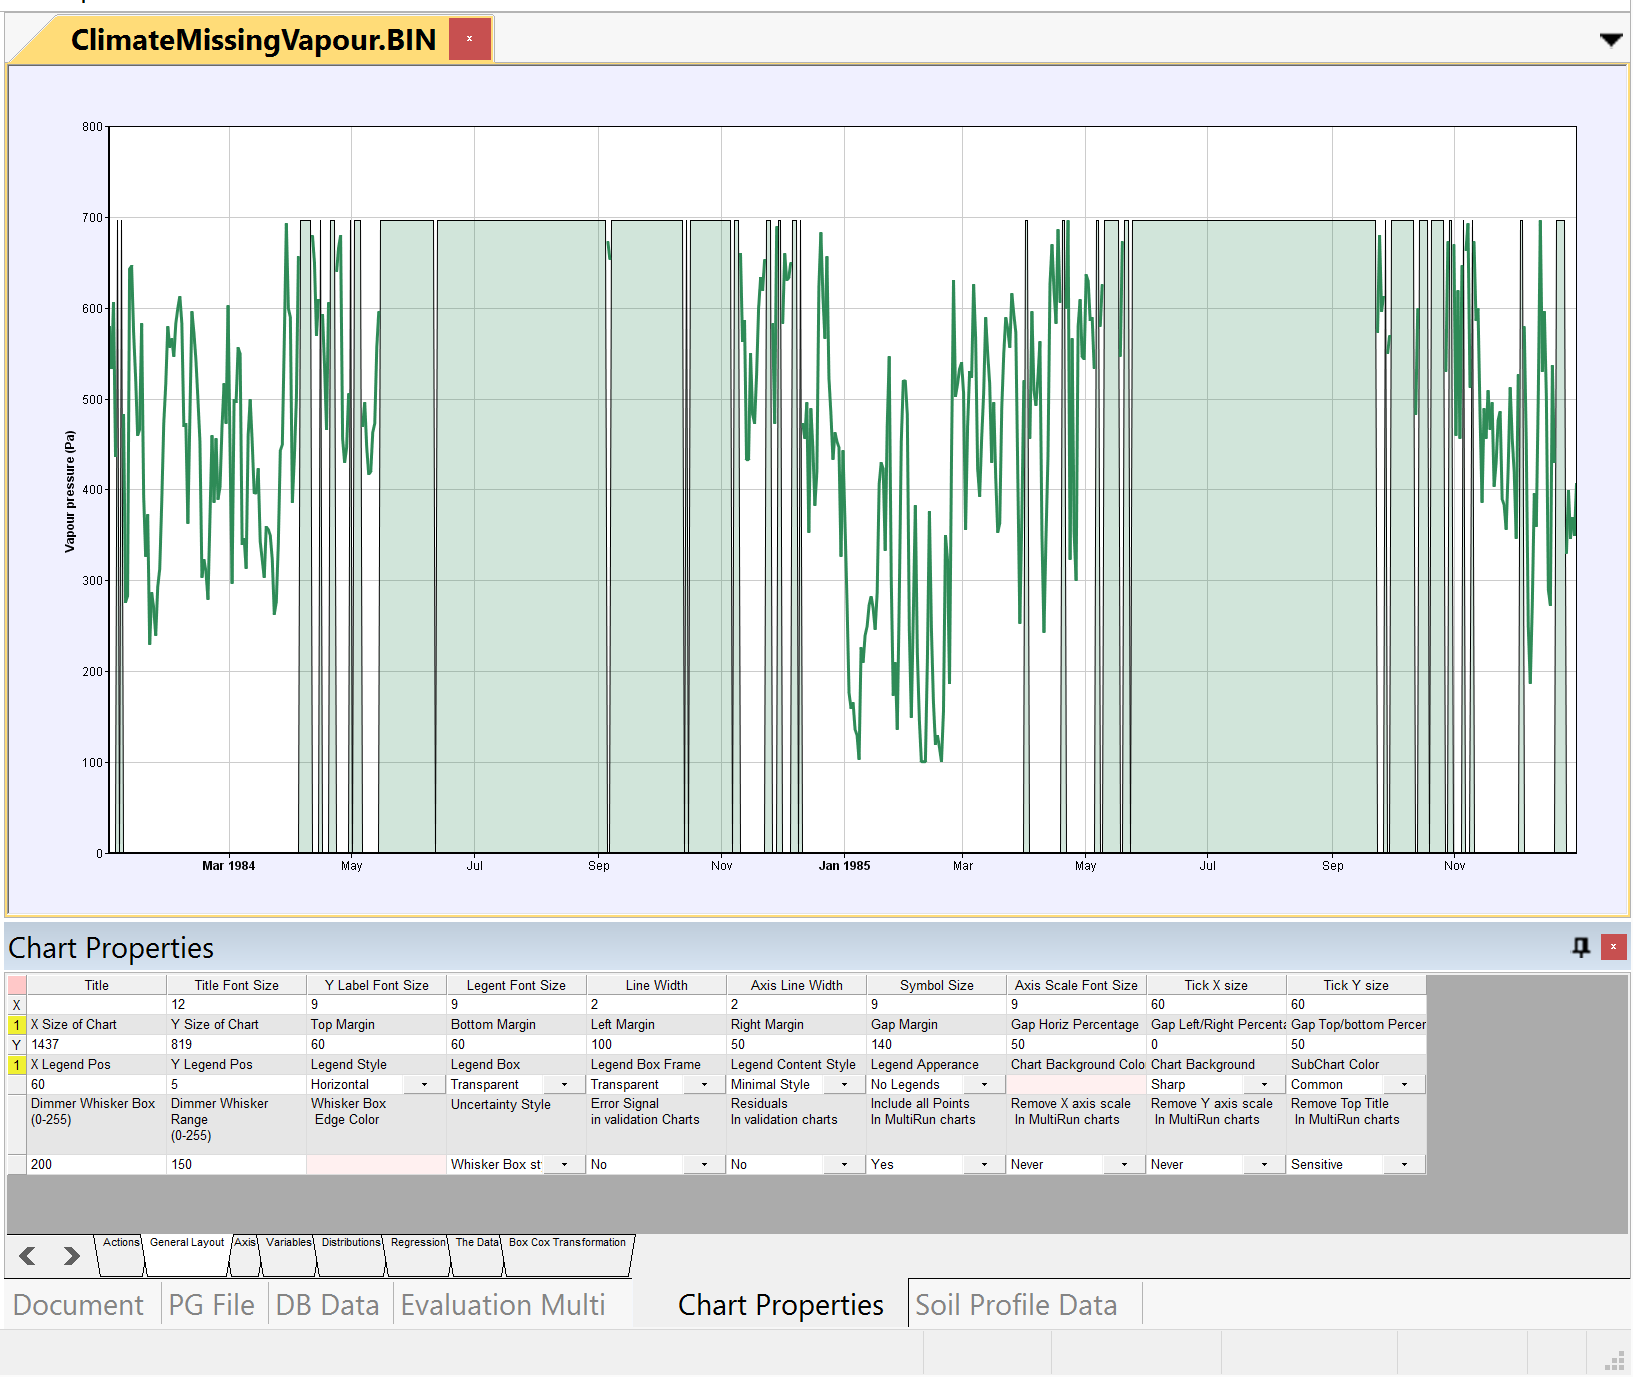
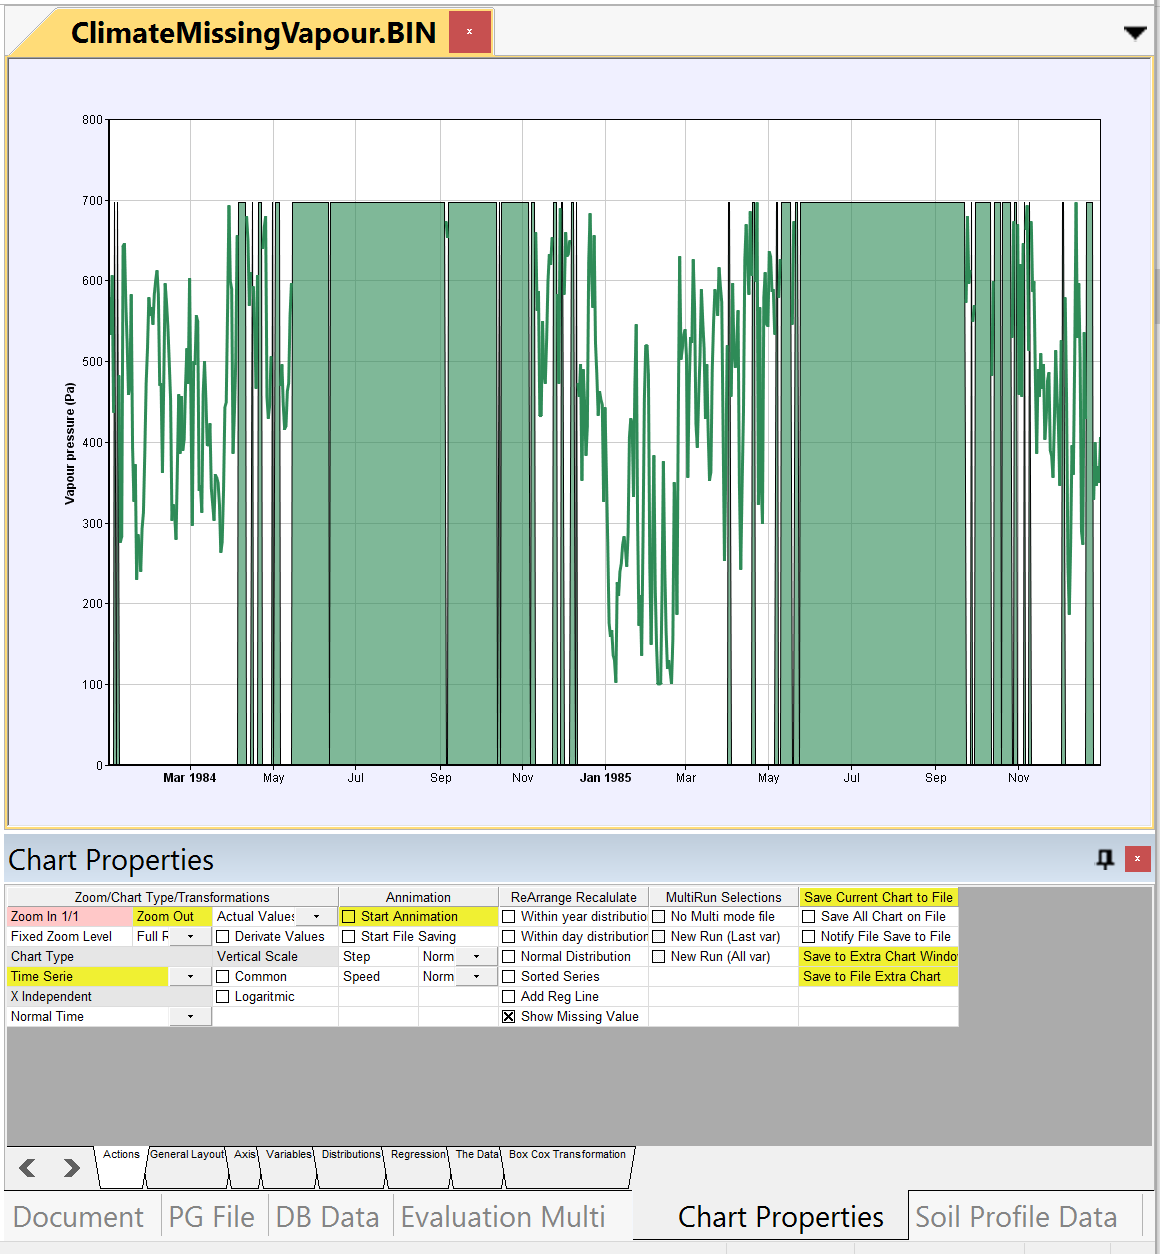
Missing values in a time serie chart will normally be visible as gaps in the charts. In some cases those gaps maybe tricky to discover clearly especially if you have a high resolution of your time serie data. A new option is now implemented that allows the missing data to be clearly shown by a area display in between the periods of no missing data. This is controlled by a new check box located in the action sheet of Chartproperties window. Note that the colour of the area showing regions with missing value is the same as for the variable. The transparency of the area will be controlled by the same dimmer parameter as used for whisker box charts. See the general Layour sheet of the Chart Properties sheet.