Simulated Canopy Height
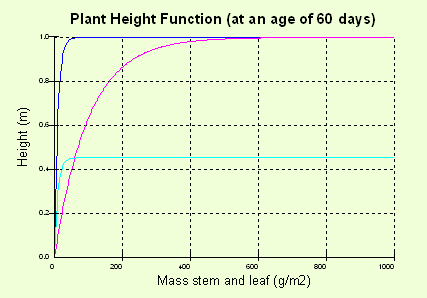
Simulated canopy height as a function of the biomass in the stem and leaves. The maximum height, phmax, was put to 1 for all three lines. The violet line shows the effect on height of a lower height mass coefficient, ph1, compared with the blue line. The effect of a lower age coefficient, ph2, is instead shown in the turquoise line also compared with the blue line.