Lohammar equation surface resistance, canopy
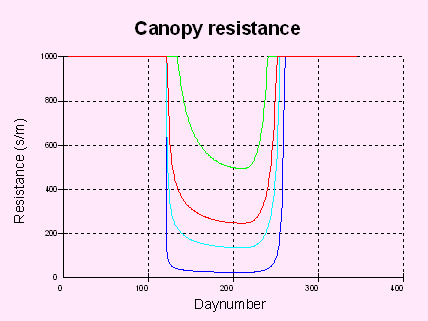
The surface resistance as a function of leaf area index calculated from the Lohammar equation. The blue line shows the original parameter setting. The green curve shows the effect of a higher gris, the turquoise line shows the effect of a lower gvpd and the red line shows the effect of a lower gmax. The wind speed was 2 m/s, the light was 25 MJ/m2/day and the VPD was 100 Pa.