Only some of the attributes when creating new charts have been saved for later session after a session of using the CoupModel. Also the characteristics like (line, thickness of line, symbol and symbol size for the data points have been for each variable separately. To Allows simpler and quick reassignment between runs the consideration of a complete pattern for all the variables (scheeme) can be saved and retrieved by a single click (example below)
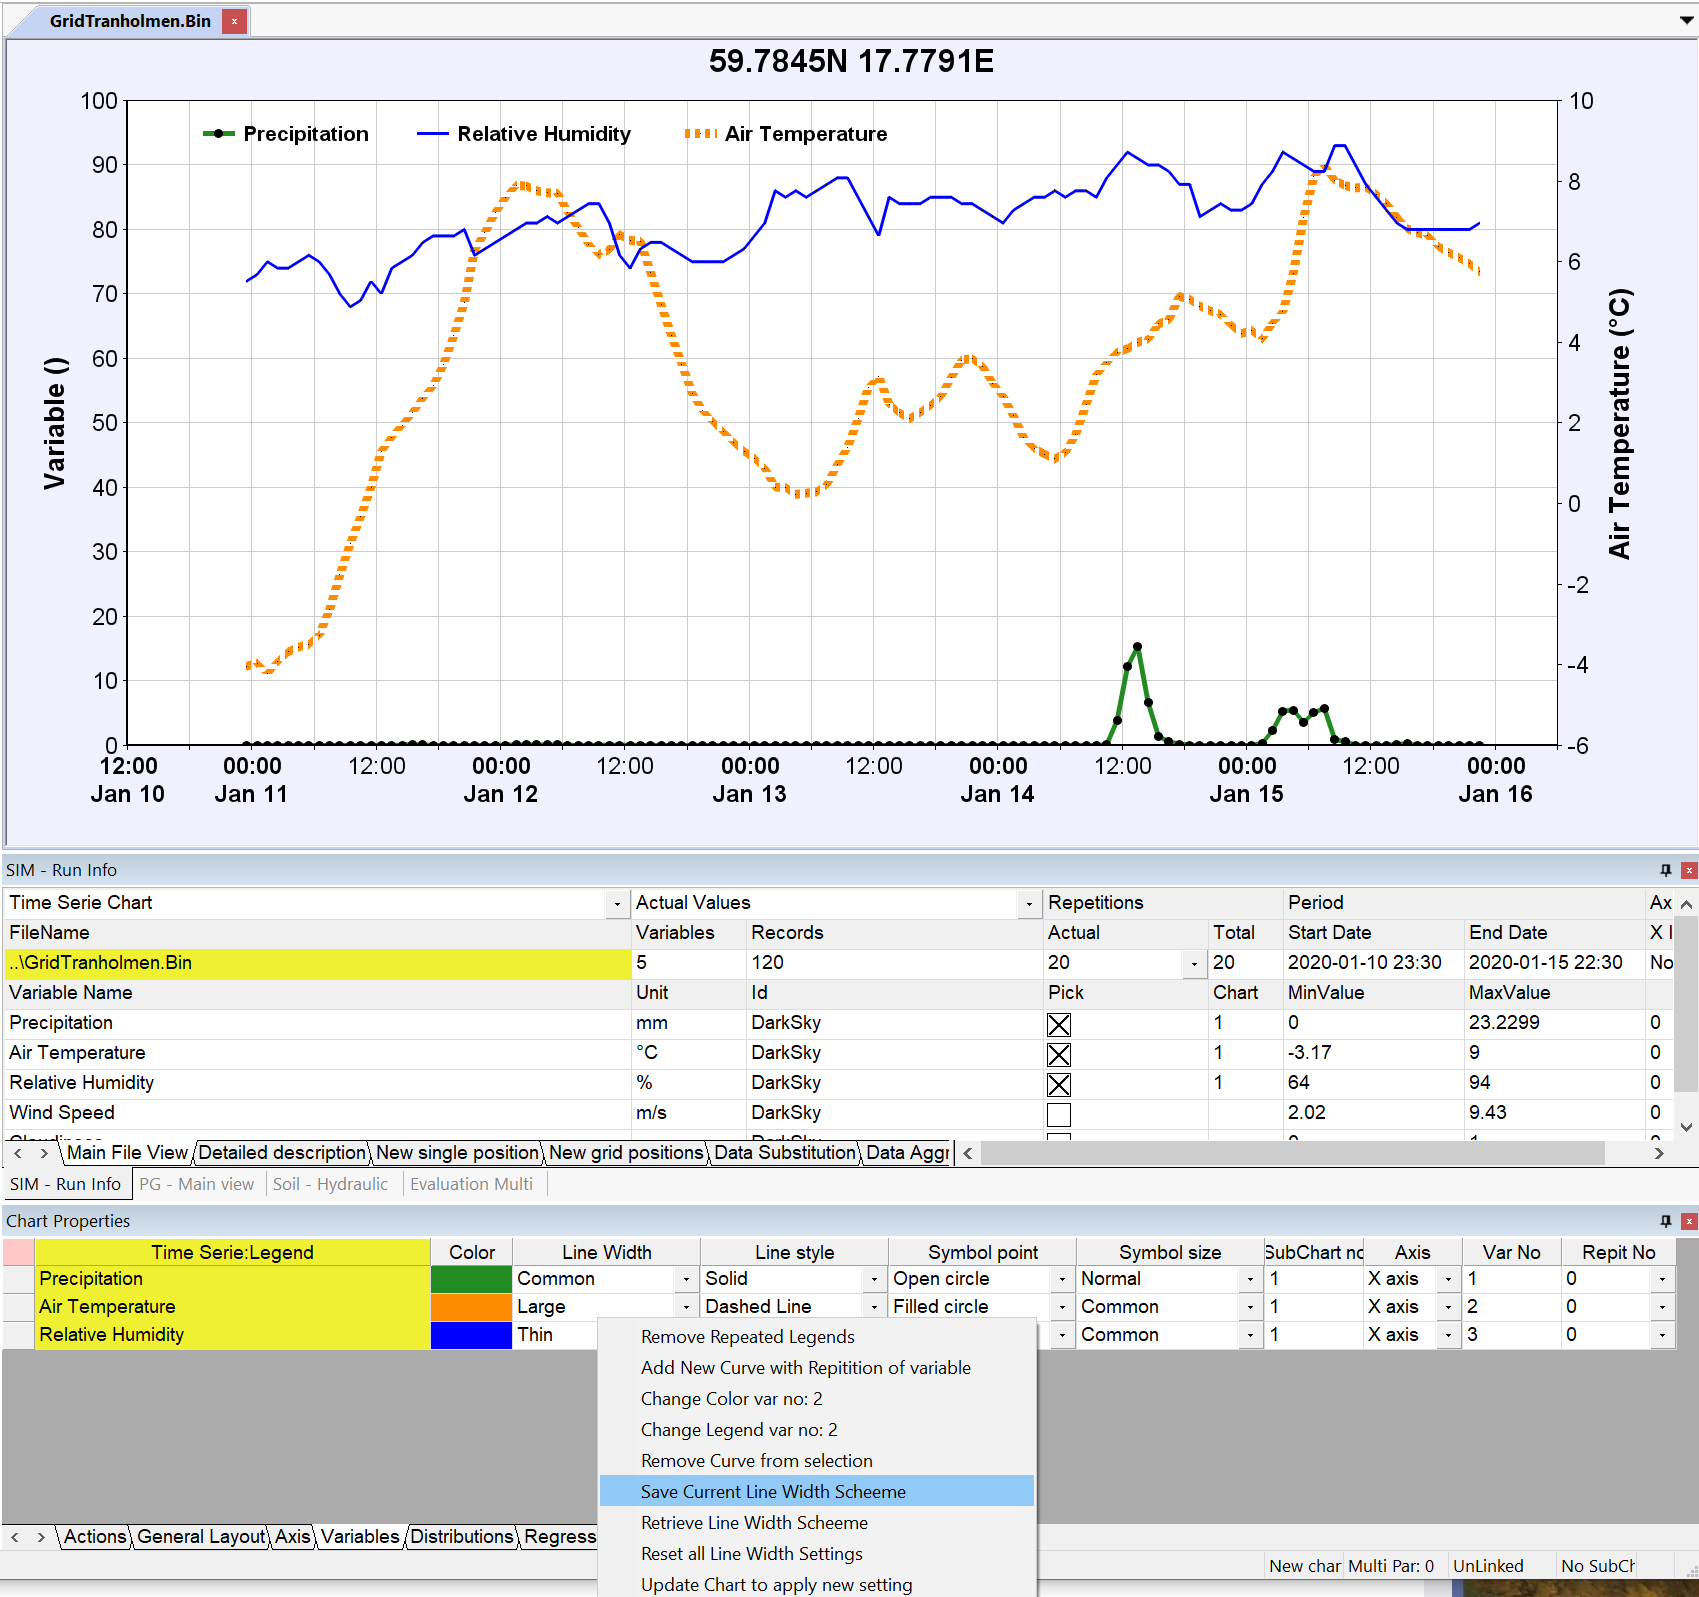
The Legends show by default when making different charts will also shift in a hopefully smarter way.
So when for instance the ID section in the Variable descriptions are all the same but more revant and sensivite information may be available in the additional descriptors like the geografical position. The chart will pick up other fields and display those automatically. Note also that the 3 Different variables will create a right scale representation and a left scale representation.´The title of a chart will also be suggested from the legends. Common information for many variables will be “lifted” to the title automatically.
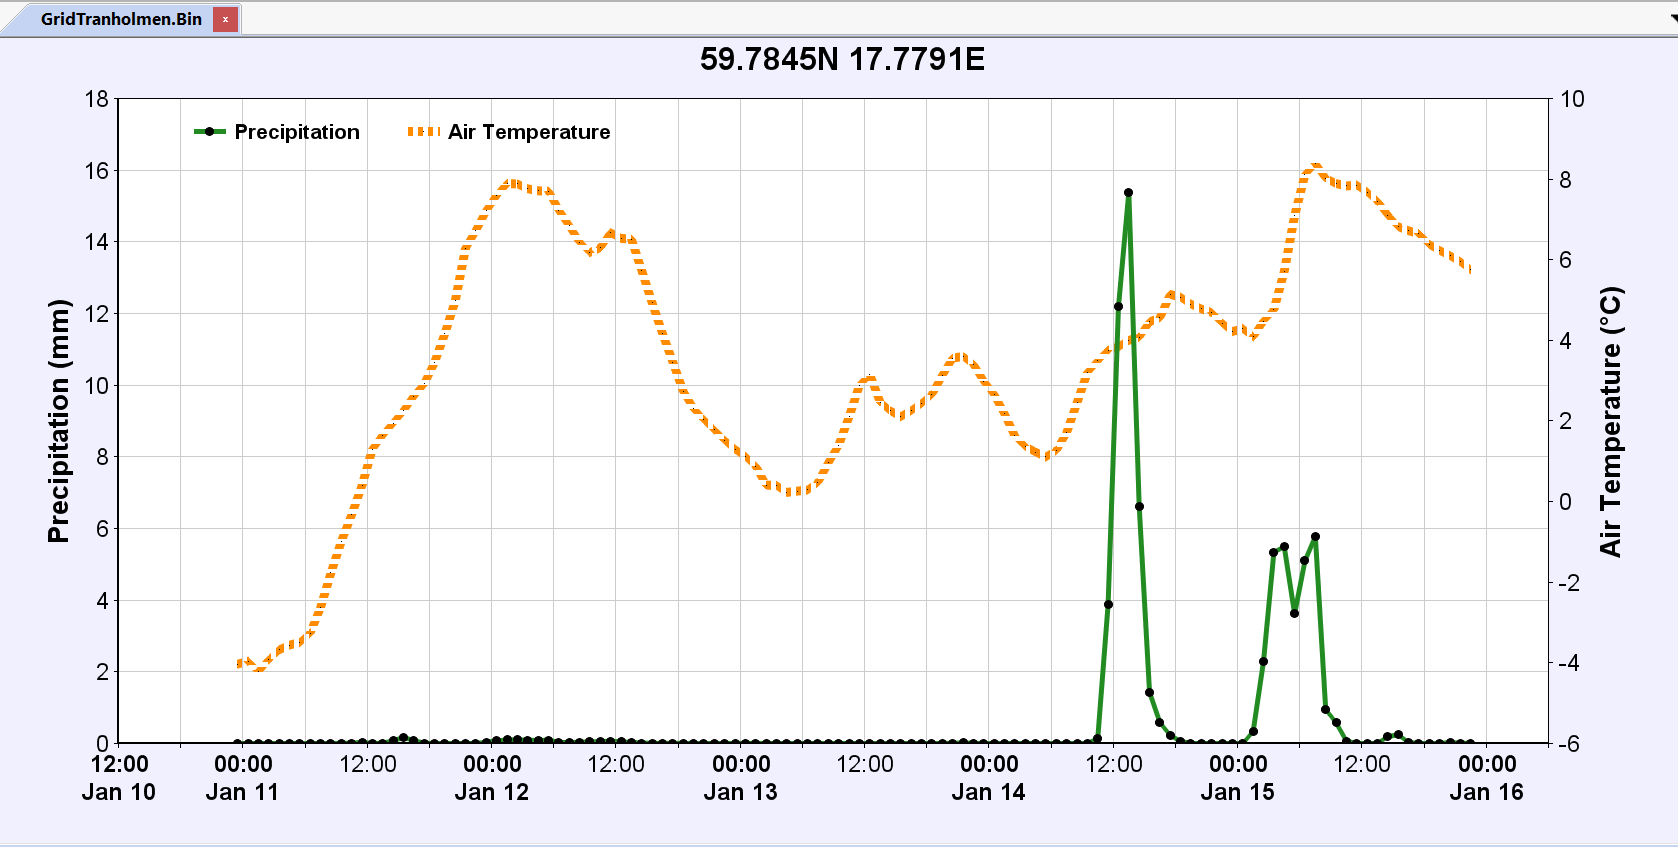
Note the example when only 2 variables are selected for a single chart below.
Also changes of Contour charts representing various latitudes and longitudes have been introduced and improved. Those will work nicely for data structures where a grided representation of meteorological data or any other variables including both variability ot time and differences in geographic representation.