MultiRuns with the CoupModel are mostly linked with some type of uncertainty based method to constrain the model outputs based on the agreement between one or more model outputs with corresponding measurements. This is done by definition of validation variables that are linked with variables from observations/measurements.
However, in some cases a MultiRuns for testing various combination of parameter values are designed for investigation of the sensivity of those parameters on some outputs. This corresponds to a normal sensitivity analysis. The most simple but very using method is to make simple scatter plots showing how one specific output can be viewed a a function of parameters or how one output can be viewed as a function of another output.
When using the Coupmodel this can easily be done by making a chart where outputs can be plotted versus parameter values or versus other model outputs.
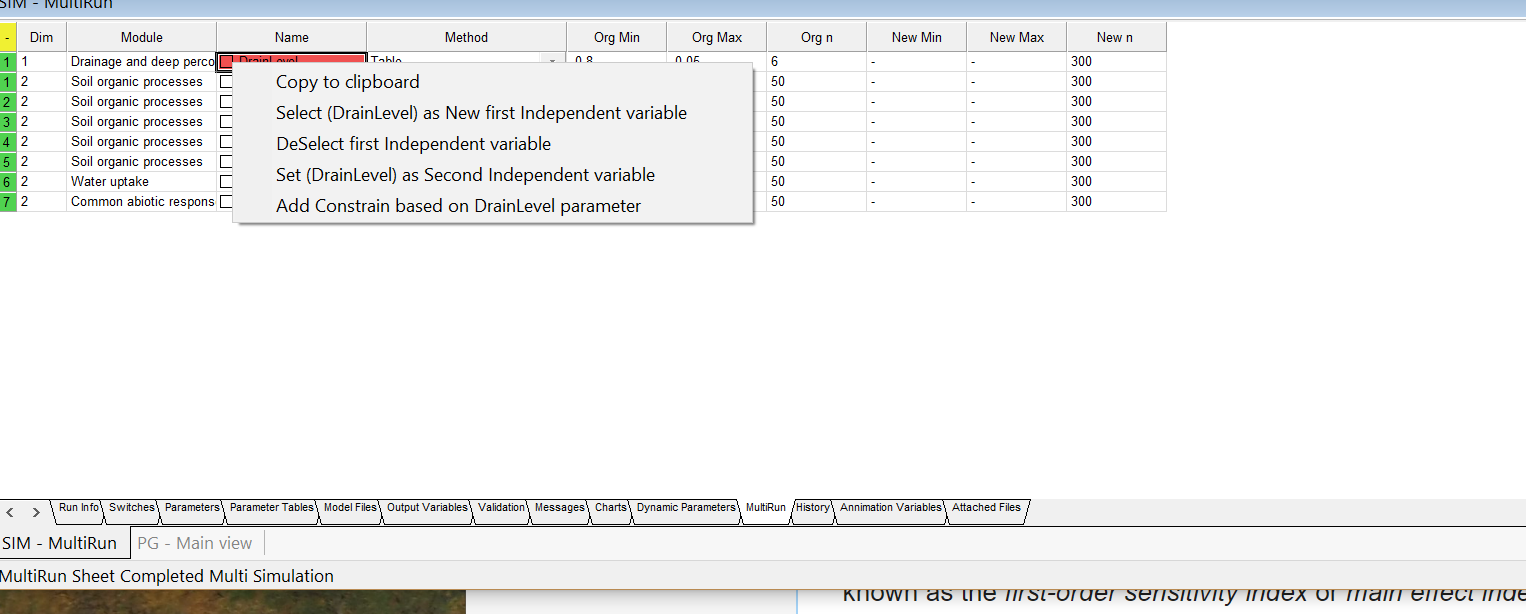
The method to do this the user make a parameter from the MultiRun sheet to be the first independent variable and then select any output variable to be viewed.
By selecting an ouput for the output variable list the chart is made in the view window.
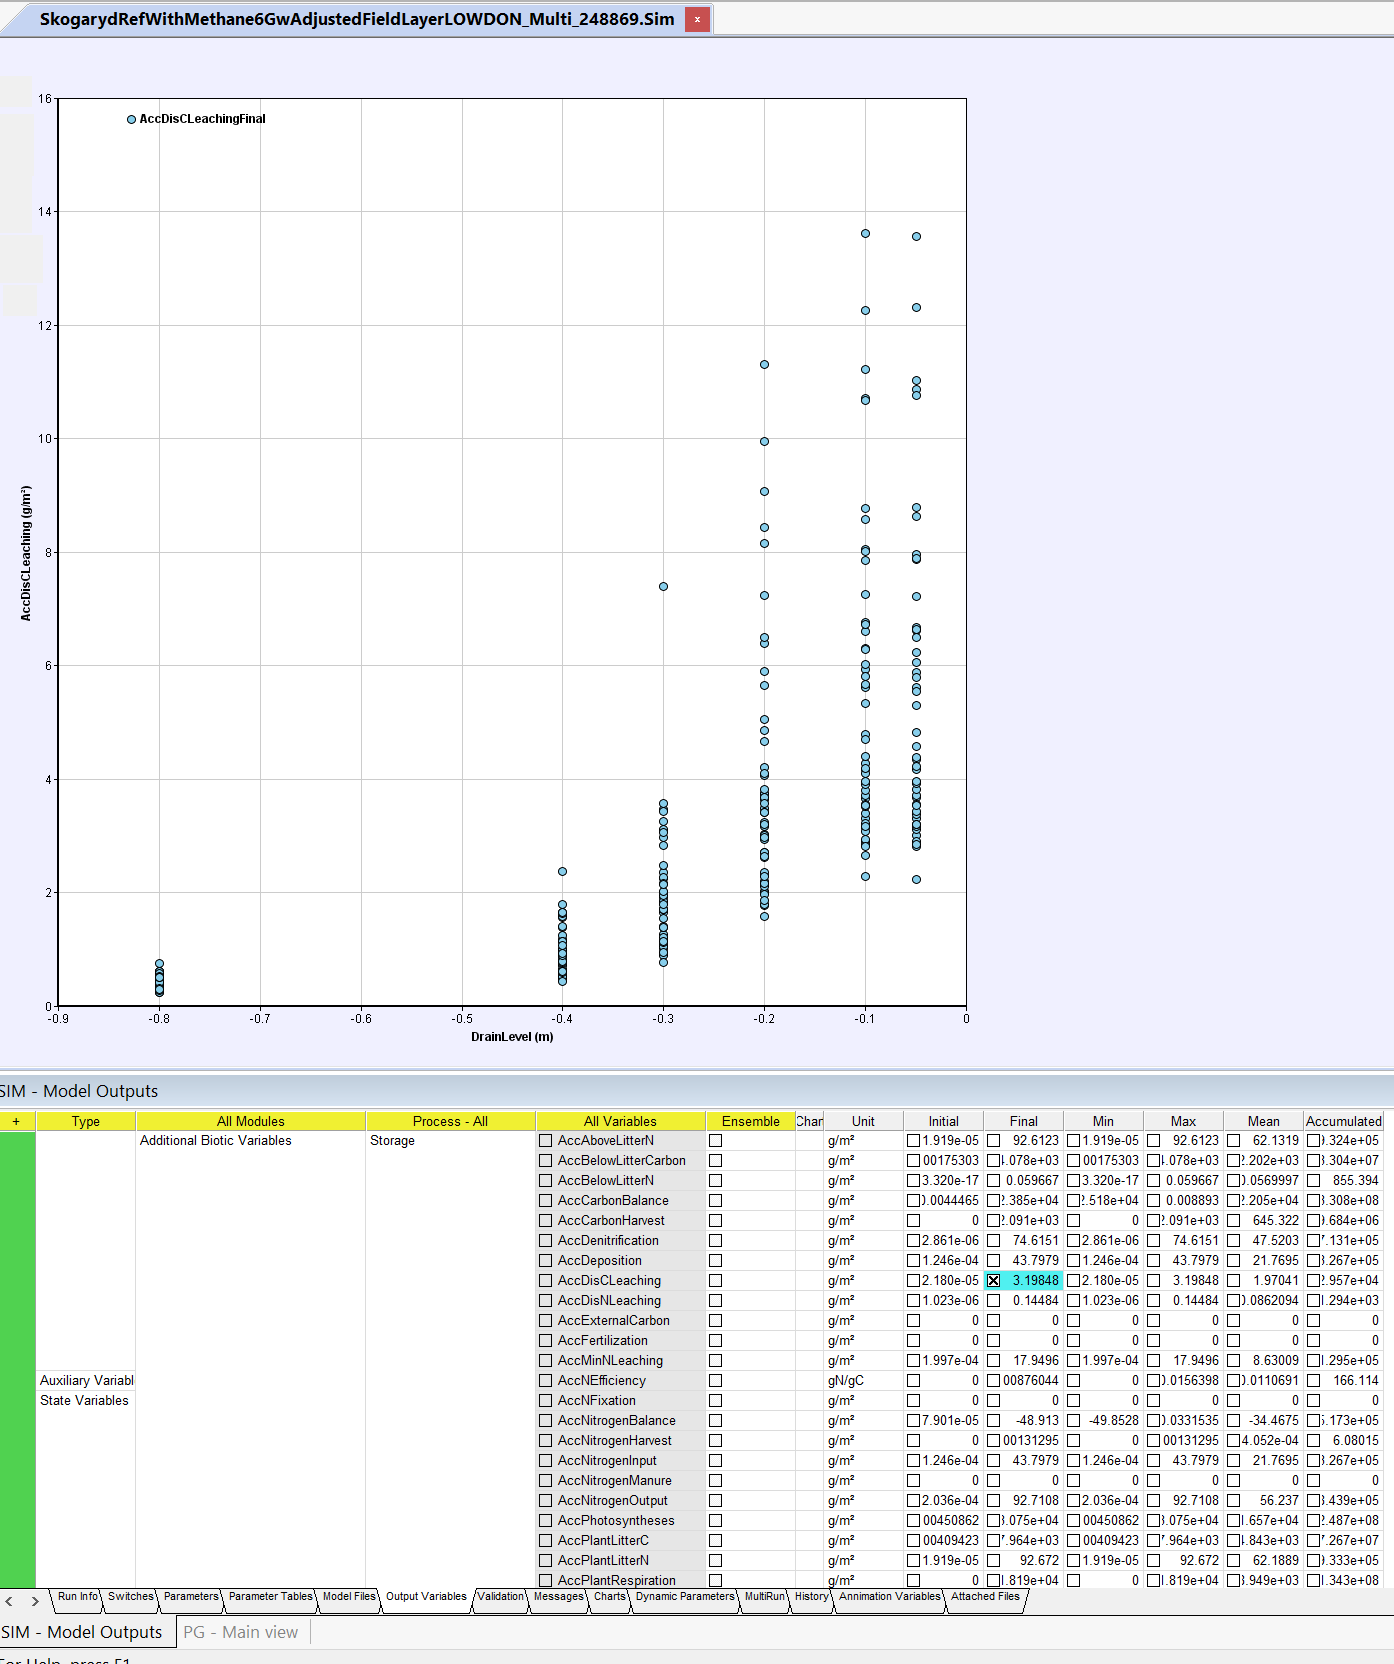
This will show all the points from the multirun made so in the case about 300 points will be in
the chart. In the example above it is obvious that the output ( DOC – AccDissolvedCLeaching ) will increate by a higher value of DrainLevel that is a parameter in the multirun list. The problem may be that variability is the results of all parameter combination and we can not know the role of all the parameters from viewing such a simple chart. The chart show the entire ensemble of all simulations made.
The new procedure that may help to identify the dependence of the other parameters.
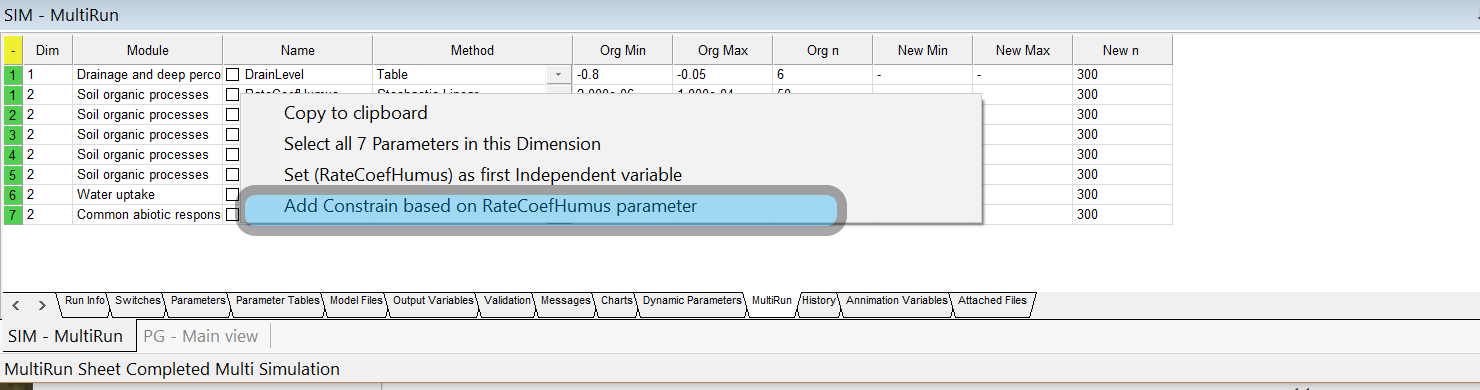
For instance if one parameter like RateCoefHumus should be constain to only a region of the range that was assumed in the multirun simulation you can define such a range of a right click on the column for the parameter name in the MultiRun List.
After selecting the parameter you can define the new range in a dialog window
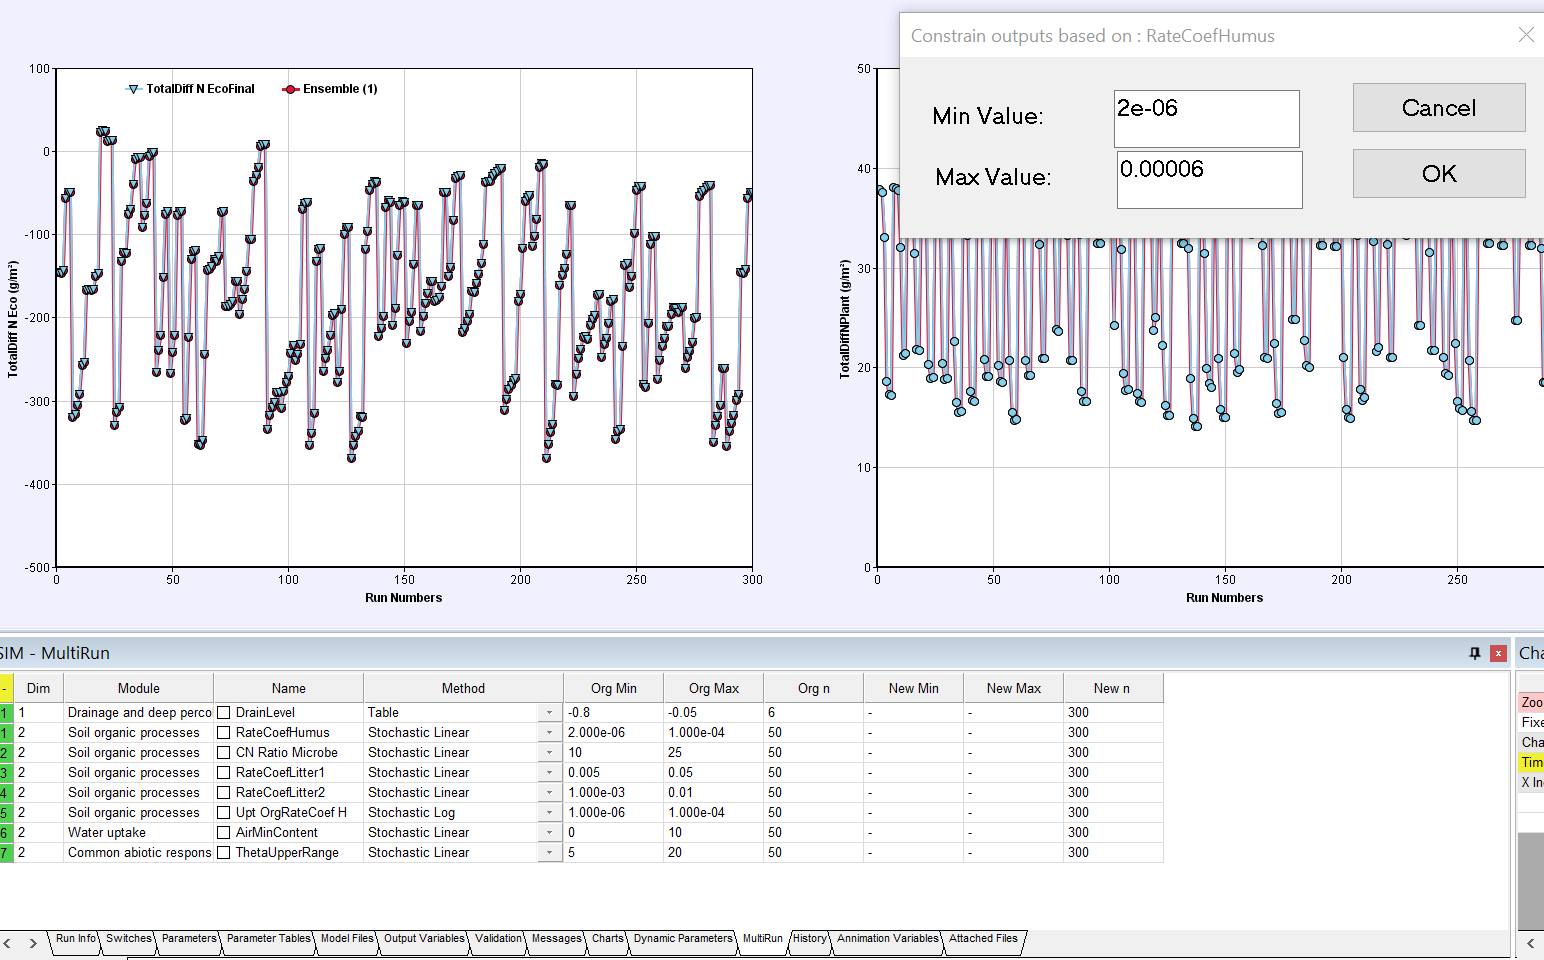
The result of the new selection will be visible in the listing of the multirun parameters
and in this case now 168 candidates remain in the resulting posterior ensemble.
Charts will be updated directly to show the results of those candidates in the posterior ensemble.
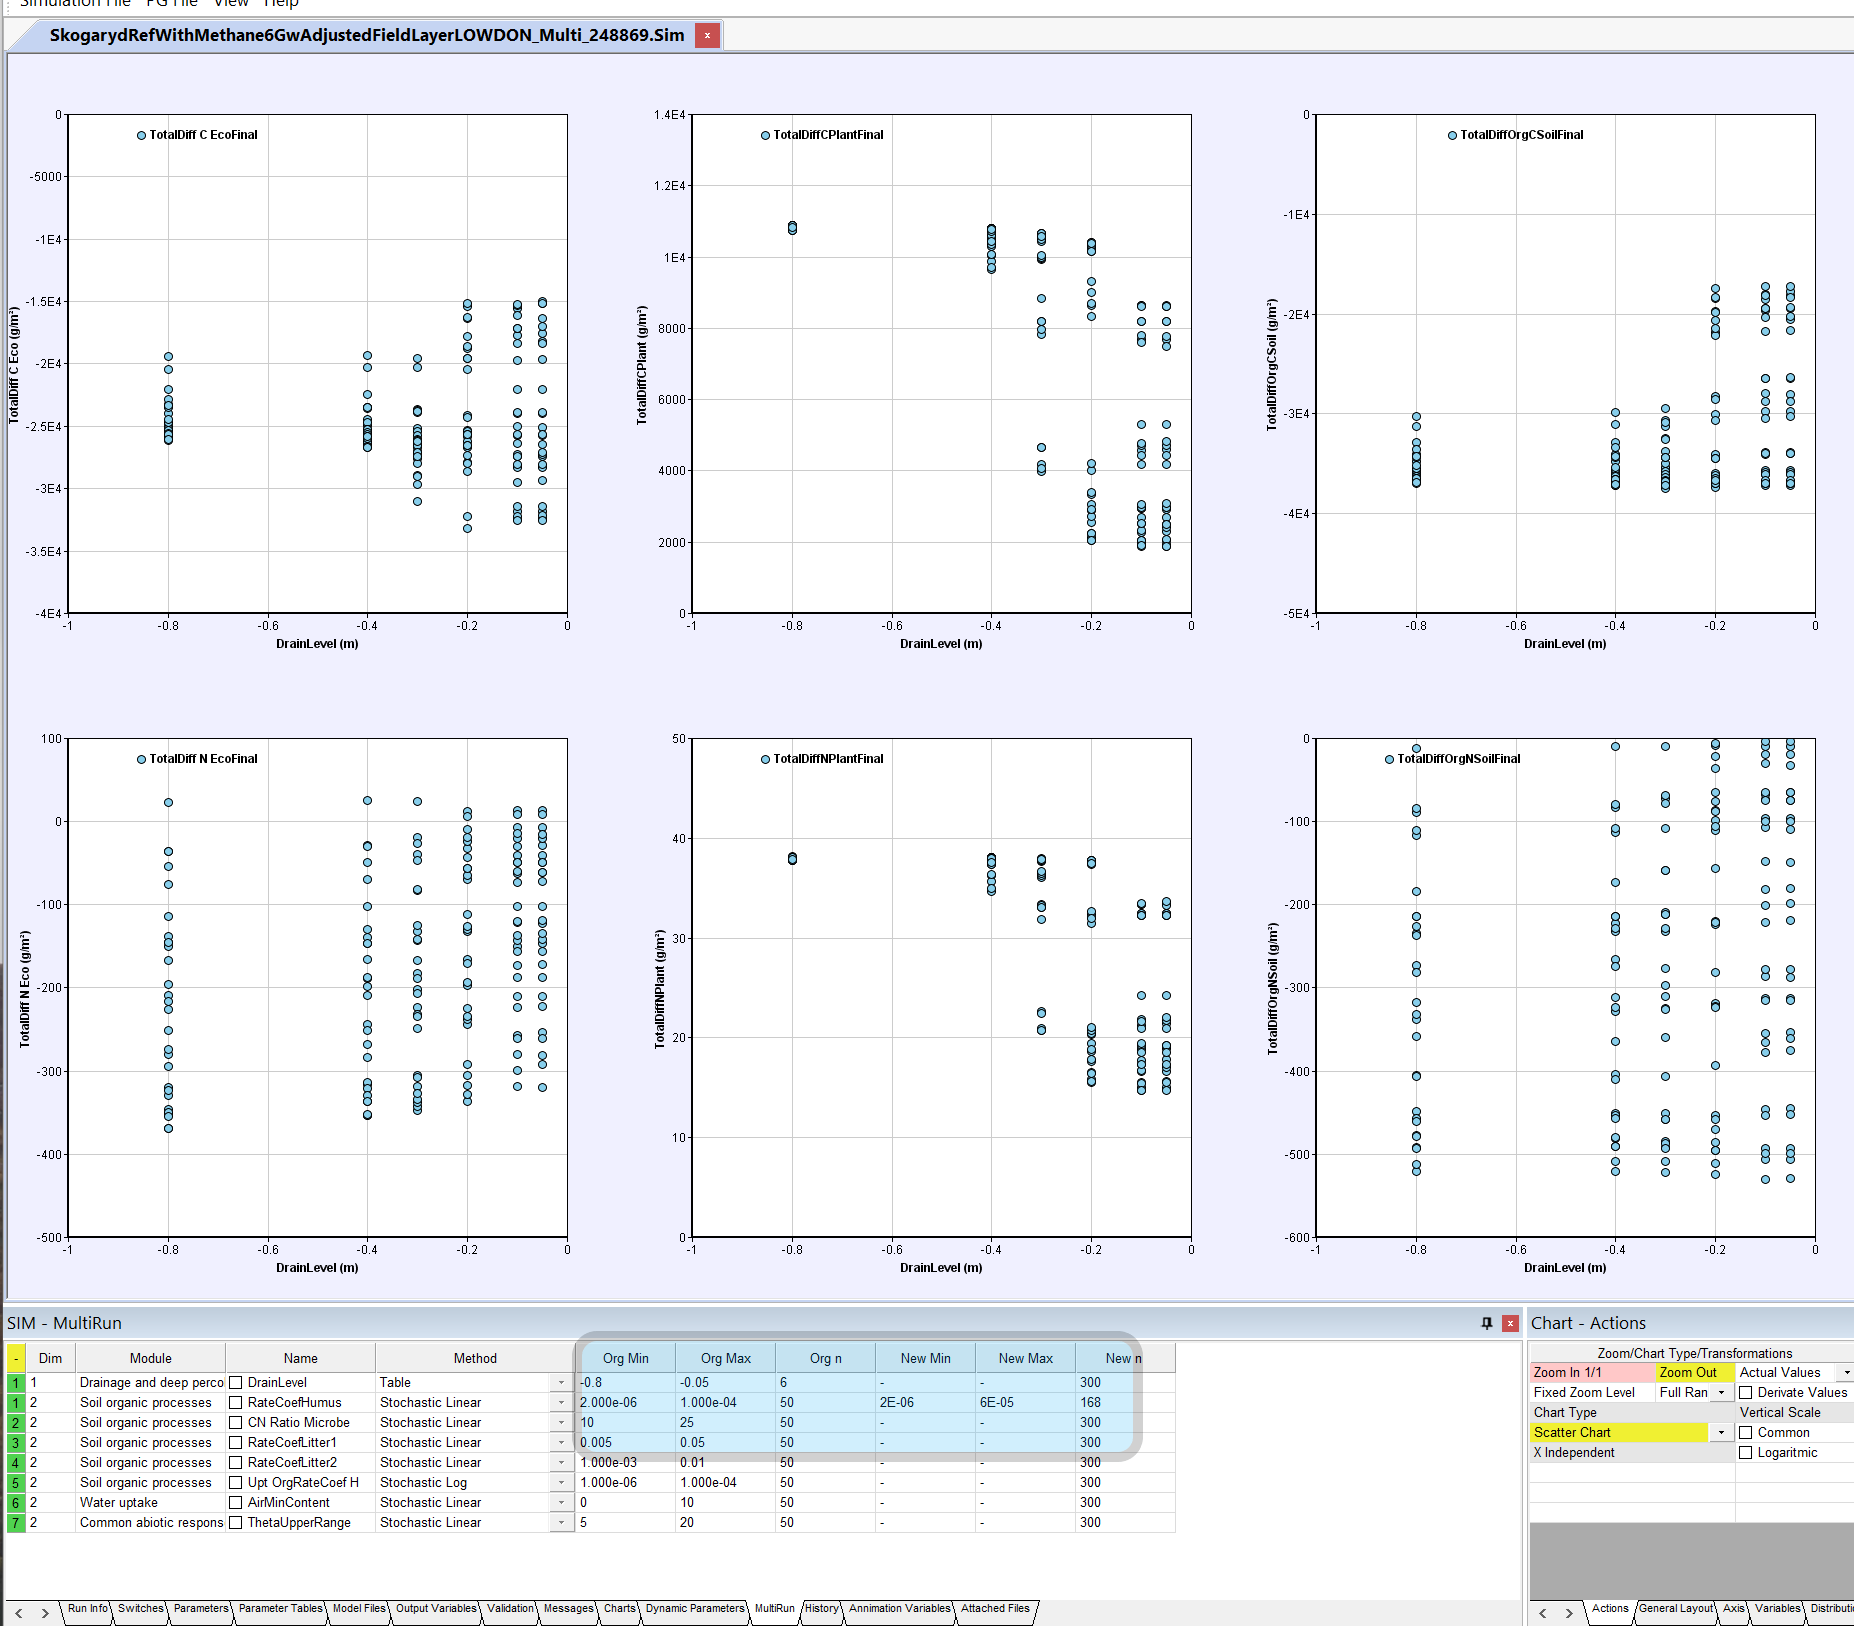
Providing you have selected 6 different output you can directly with the results on how 6 simple scatter plots will be looks like after one defined constrain.
The illustration below show an exemple where we want to see how the change of the mass balance Carbon and Nitrogen for the entire ecosystem (TotalDiff C EcoFinal), the plant storage (TotalDiffCPlantFinal) and the soil storage (TotalDiffOrcCSoilFinal) (upper 3 subchars – Carbon, lower 3 subcharts – Nitrogen).
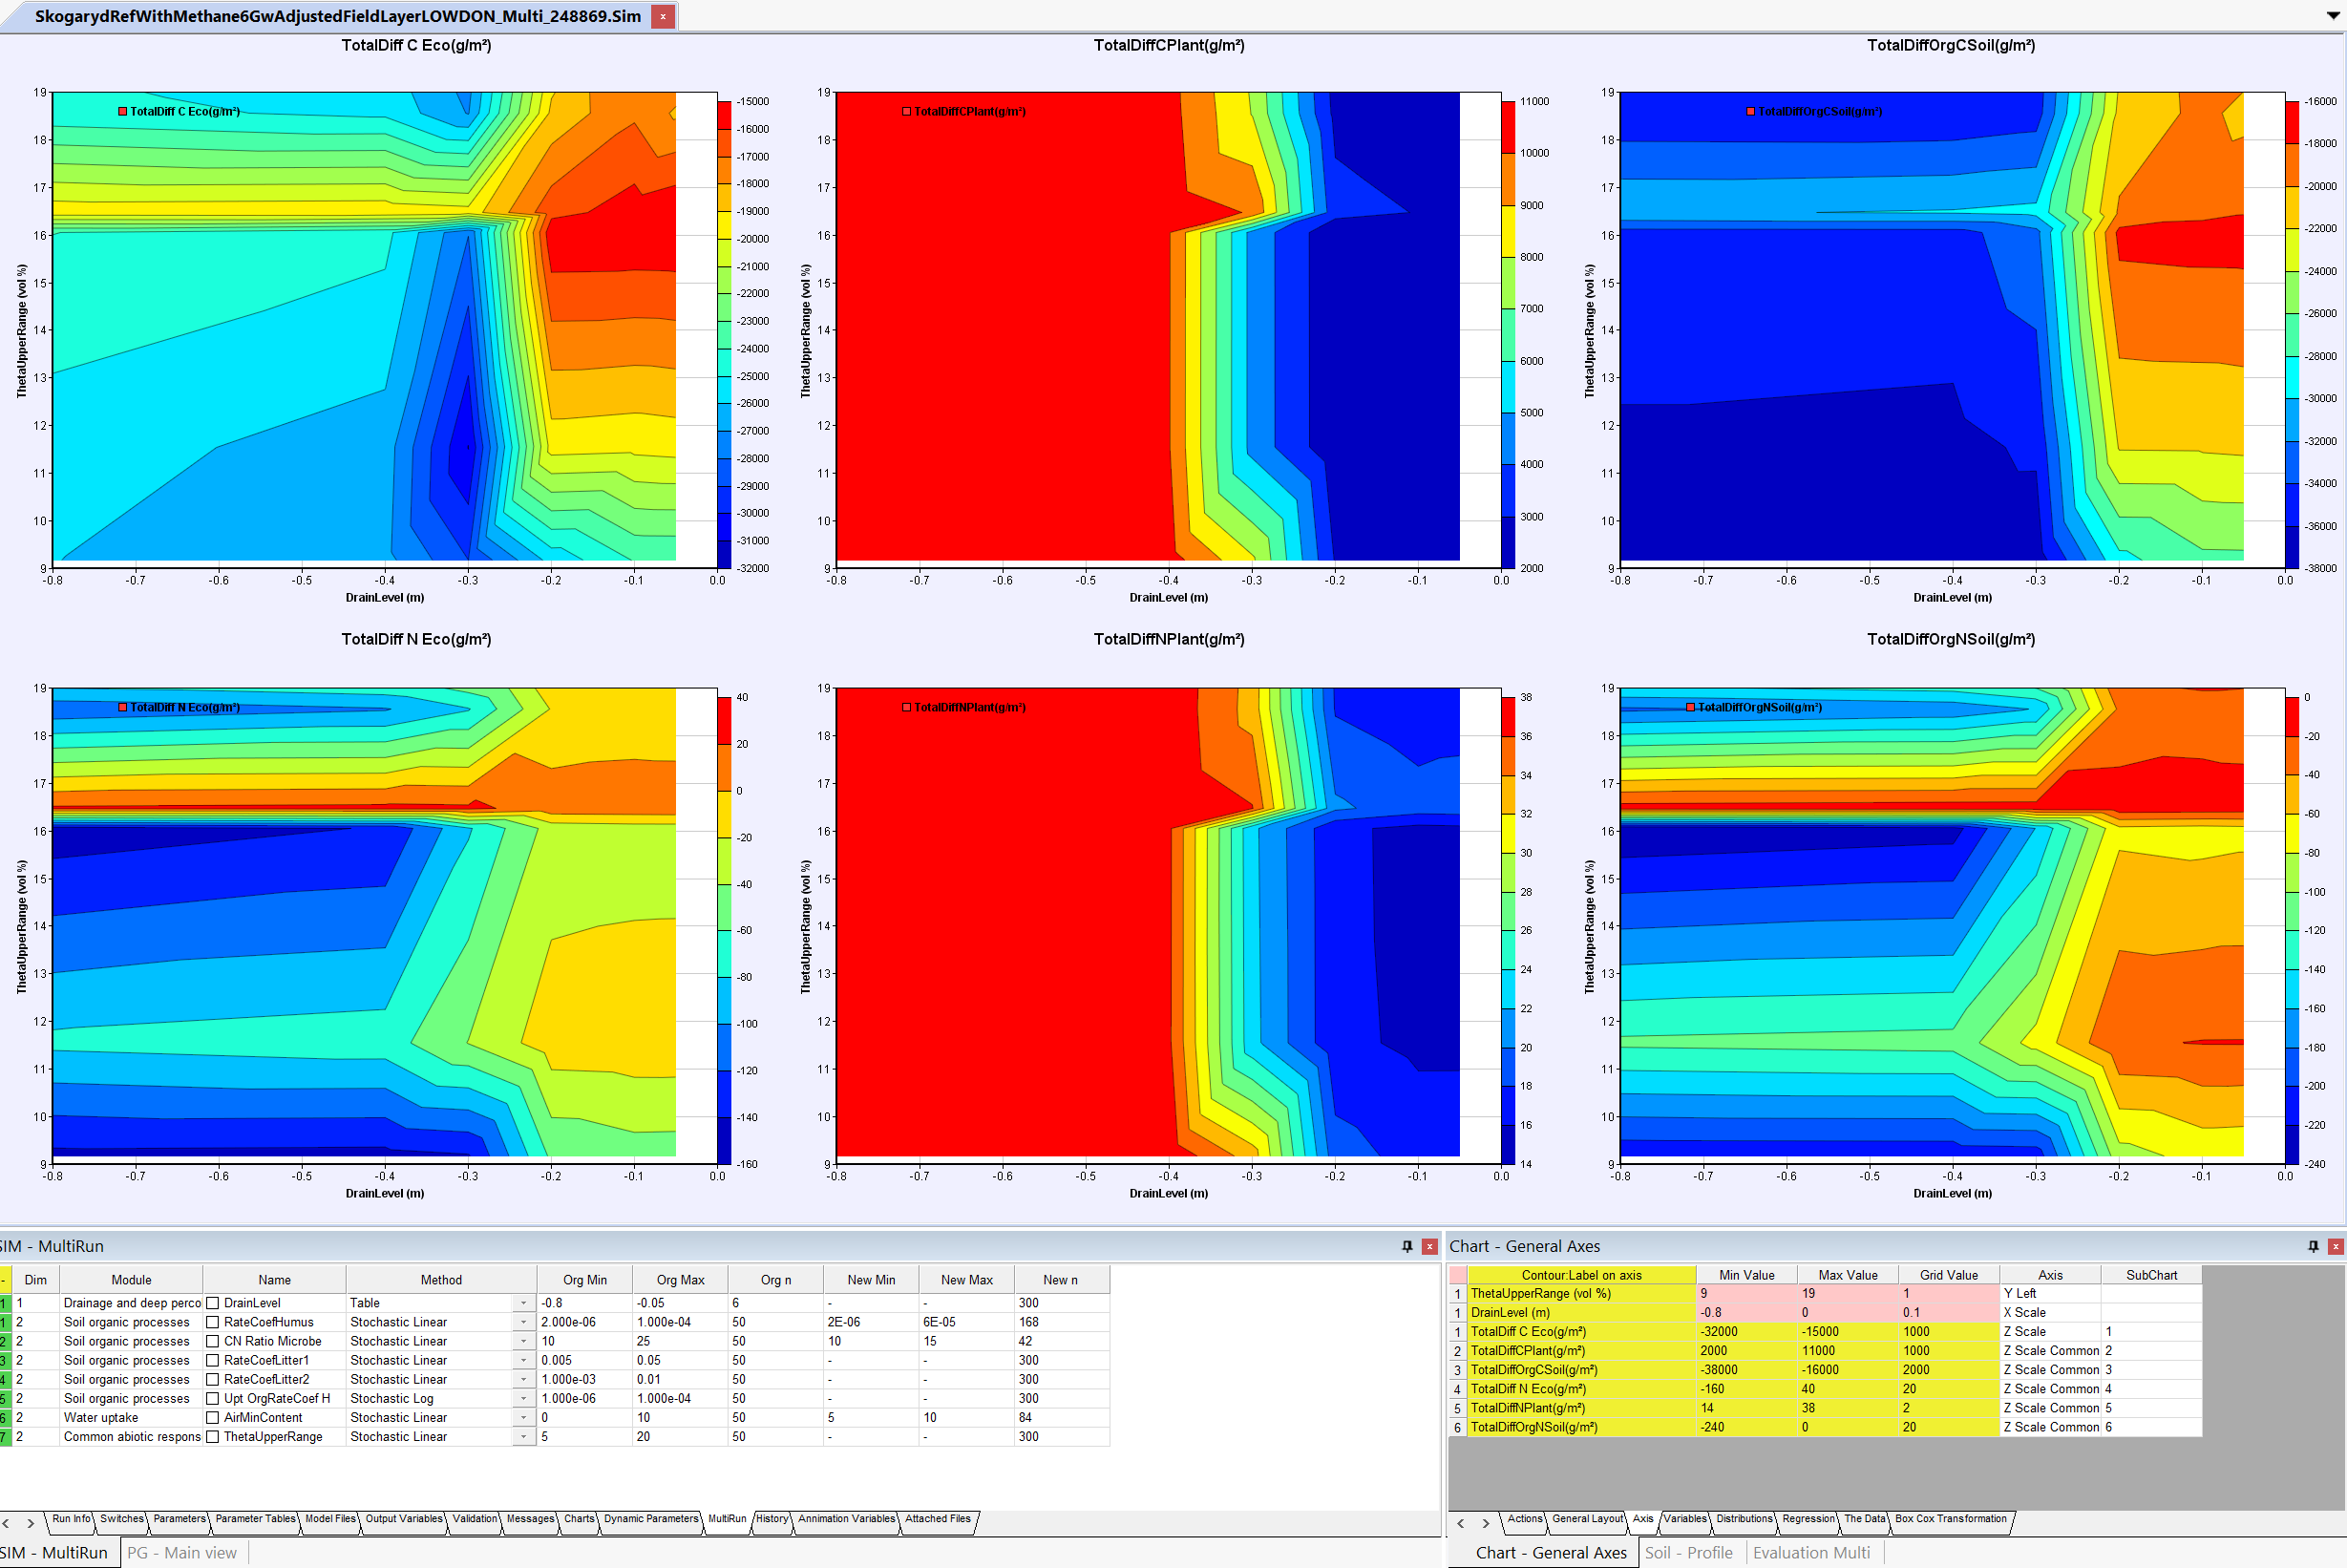
Note that you can instead make contour charts if you want to select how your ensemble can be viewed as function of two independent parameters or by additional constain of multi paramers.
This is done by definition of a second independent variable (same method as for the first) and by definition of additions constains by some other parameters (same method as for the first).
The contour chart of a constrained selection can illustrate how the dependence patterns differs i a simple way. Similarities and differences can be viewed:
and providing you saved your results from prior non constrained ensemble you can make your comparision. See results of unconstrained below:
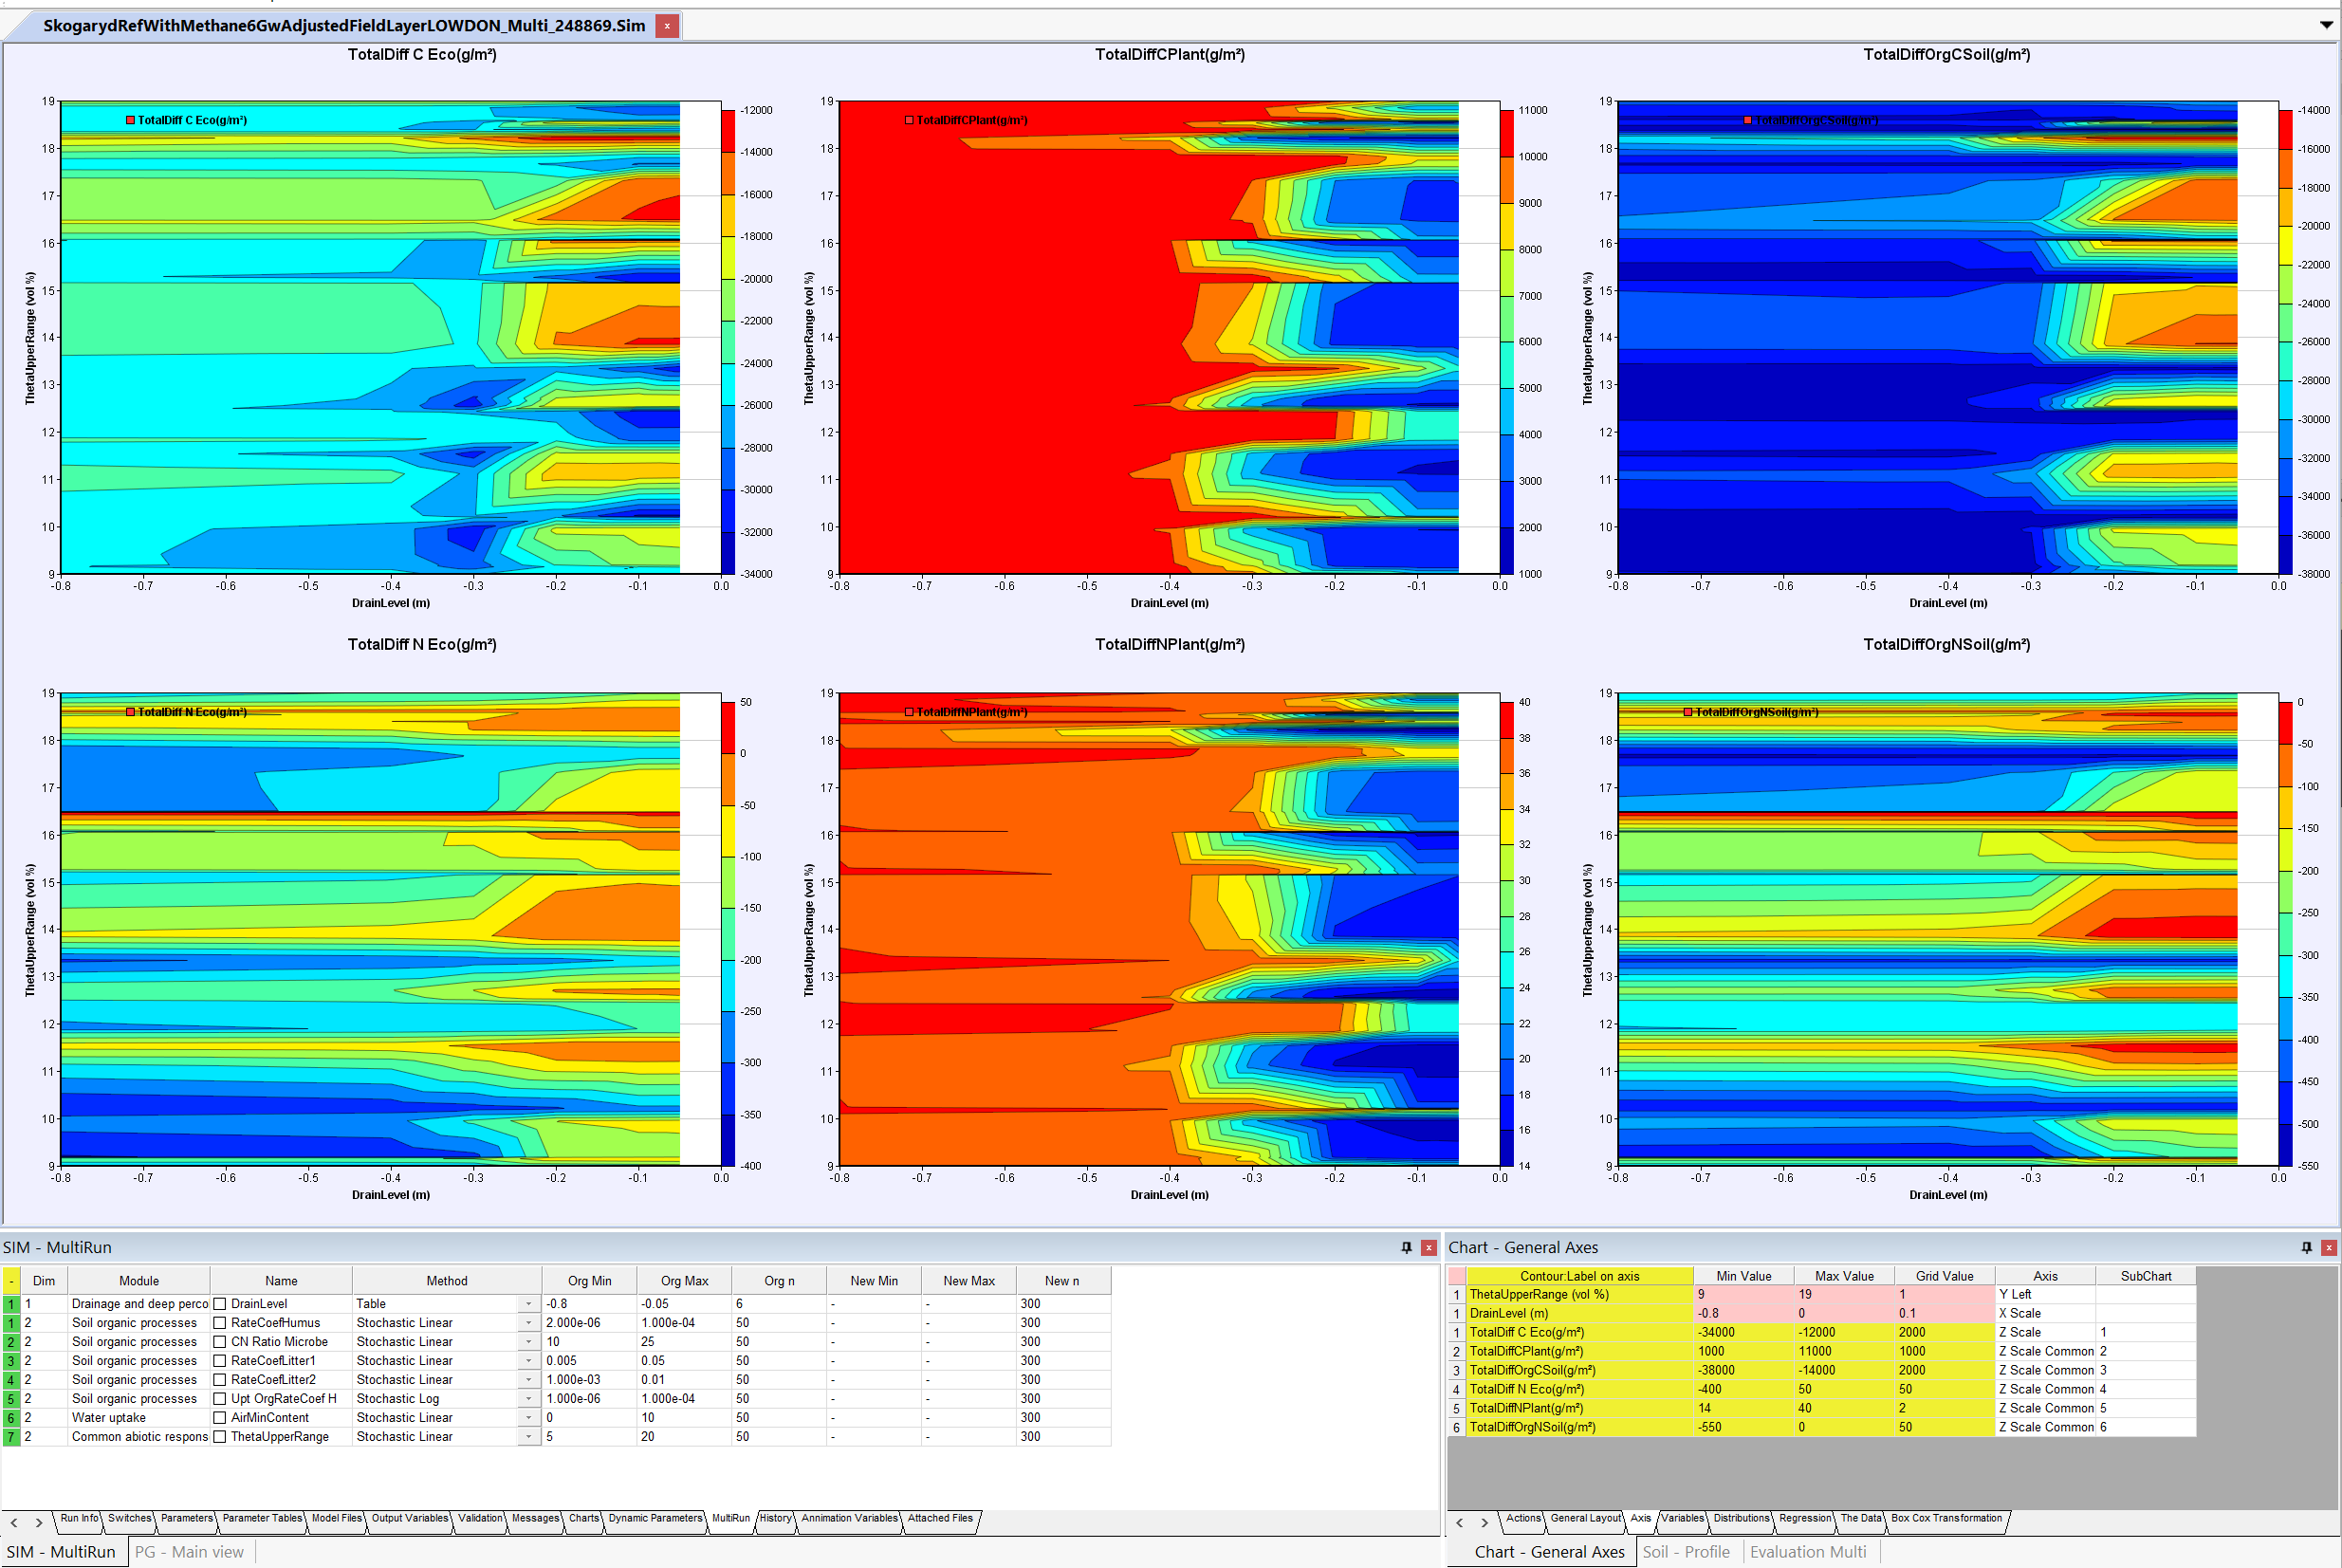
Note that the large complexity for a number of similar and counteracting parameters can be illustrated on the results.
This was a quick introduction to the new feature. I do look forward to have comments for further development of this technique and how it may be combined with other methods to makes sensitivity analysis. Note that I do not recommend this for all parameters and parameter combinations. A selection based on your expectations are highly recommended. Also note that is a method to understand the results of the model. You can compare with your possible expectations on how to understand the dependences between various properties of ecosystem in the nature.