Some bugs has been deleted related to the new feature of MultiSite Calibrations using a GLUE or Bayesian approach. Please download latest version from today.
Most important new feature is that the data can now be visualized showing also the performance for individual sites (= variability withing Dimension1) as well as the aggregated performance of all runs withing dimension 1.
A complete demo dataset used to calibrate the CoupModel for 4 sites with 3 specific conditions of those years are made available to show the new feature.
Both GLUE and Bayesian examples are included.
A short description of the data and the setup shows steps for making the simulation.
Starting point is to design a 2 dimension of MultiRun.
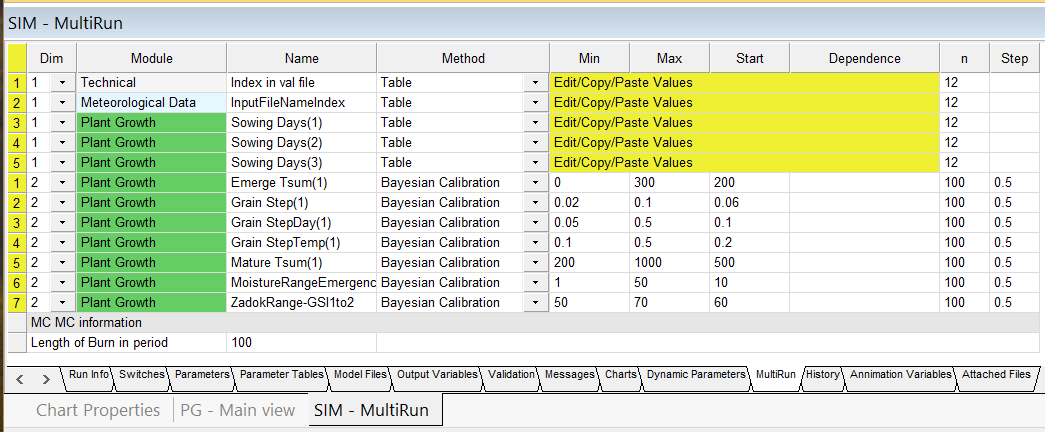
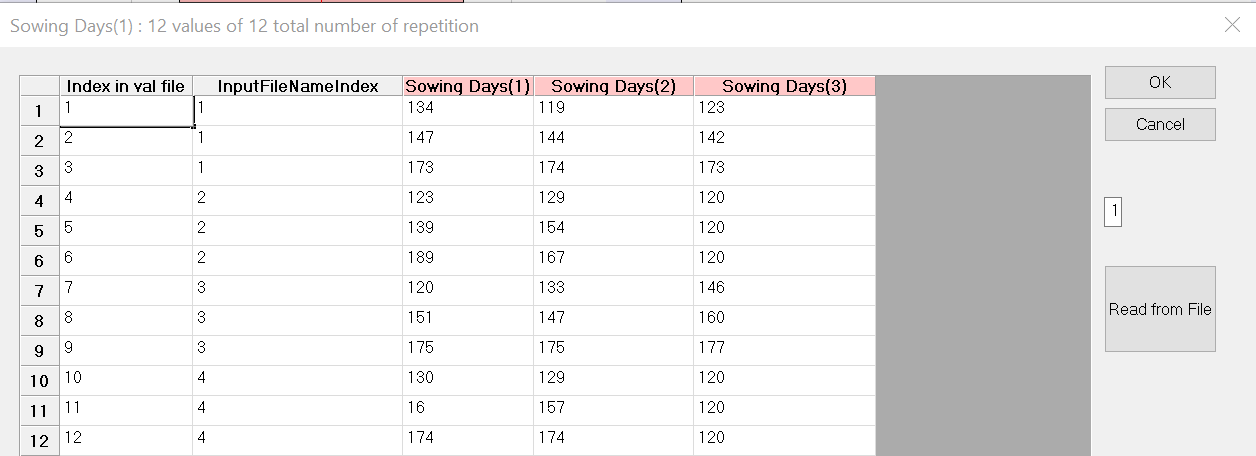
The first dimension includes site specific parameters that are controlling the runs from a table of fixed setting.
Those parameters are used both the set selection of input climate file as well as for controlling which validation that should be made for each of the different sites.
The input files are:
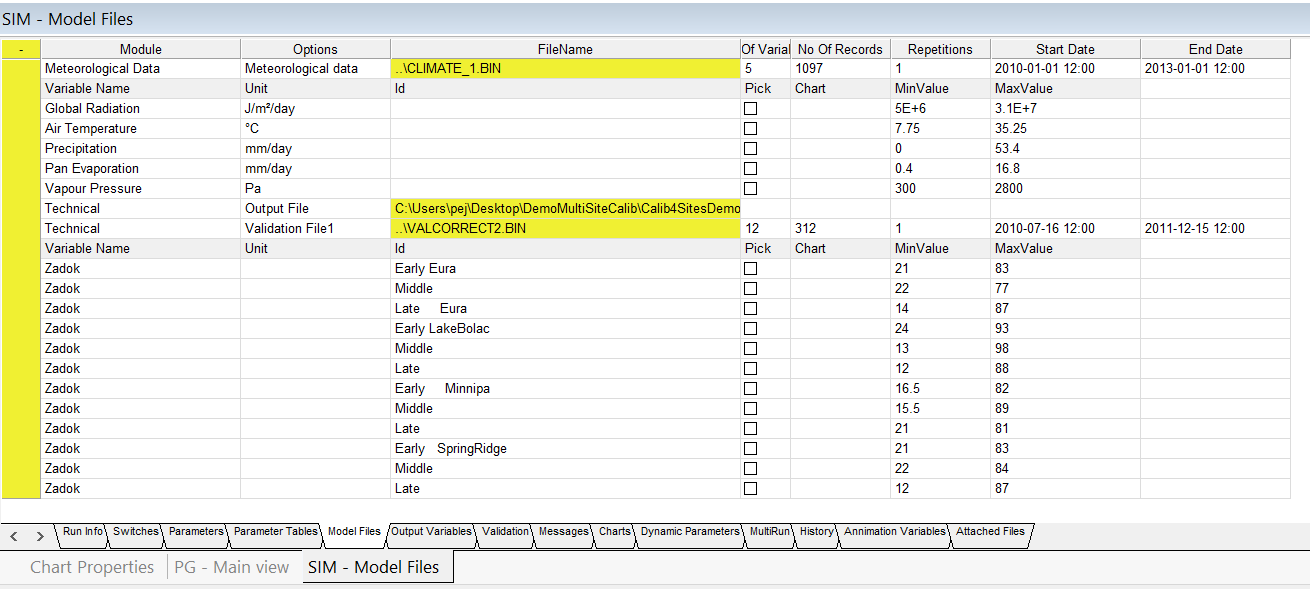
Selection of Climate file is made by the InputFileNameIndex
![]()
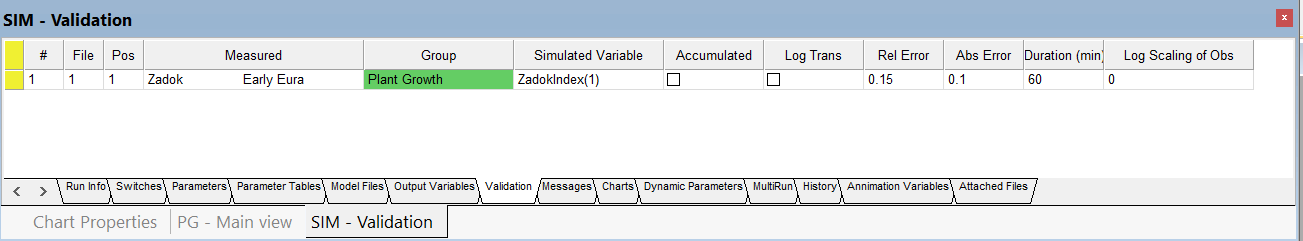
Selection of Validation Variable is made by the Index in val File parameter
Both of those are part of the dimension 1 parameters.
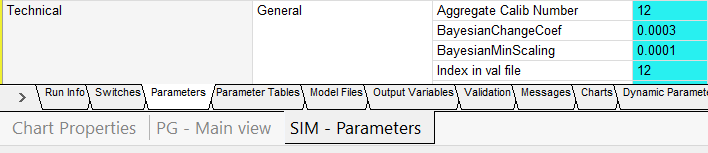
Note that the Validation is made by only one single Validation Variable.
After a multiRun has been completed that single Validation variables is split into separate variables to view the performance for individual runs. However, the selection of valid candidates for the ensemble is made for a common value of the performance for all the candidates within the first dimension.
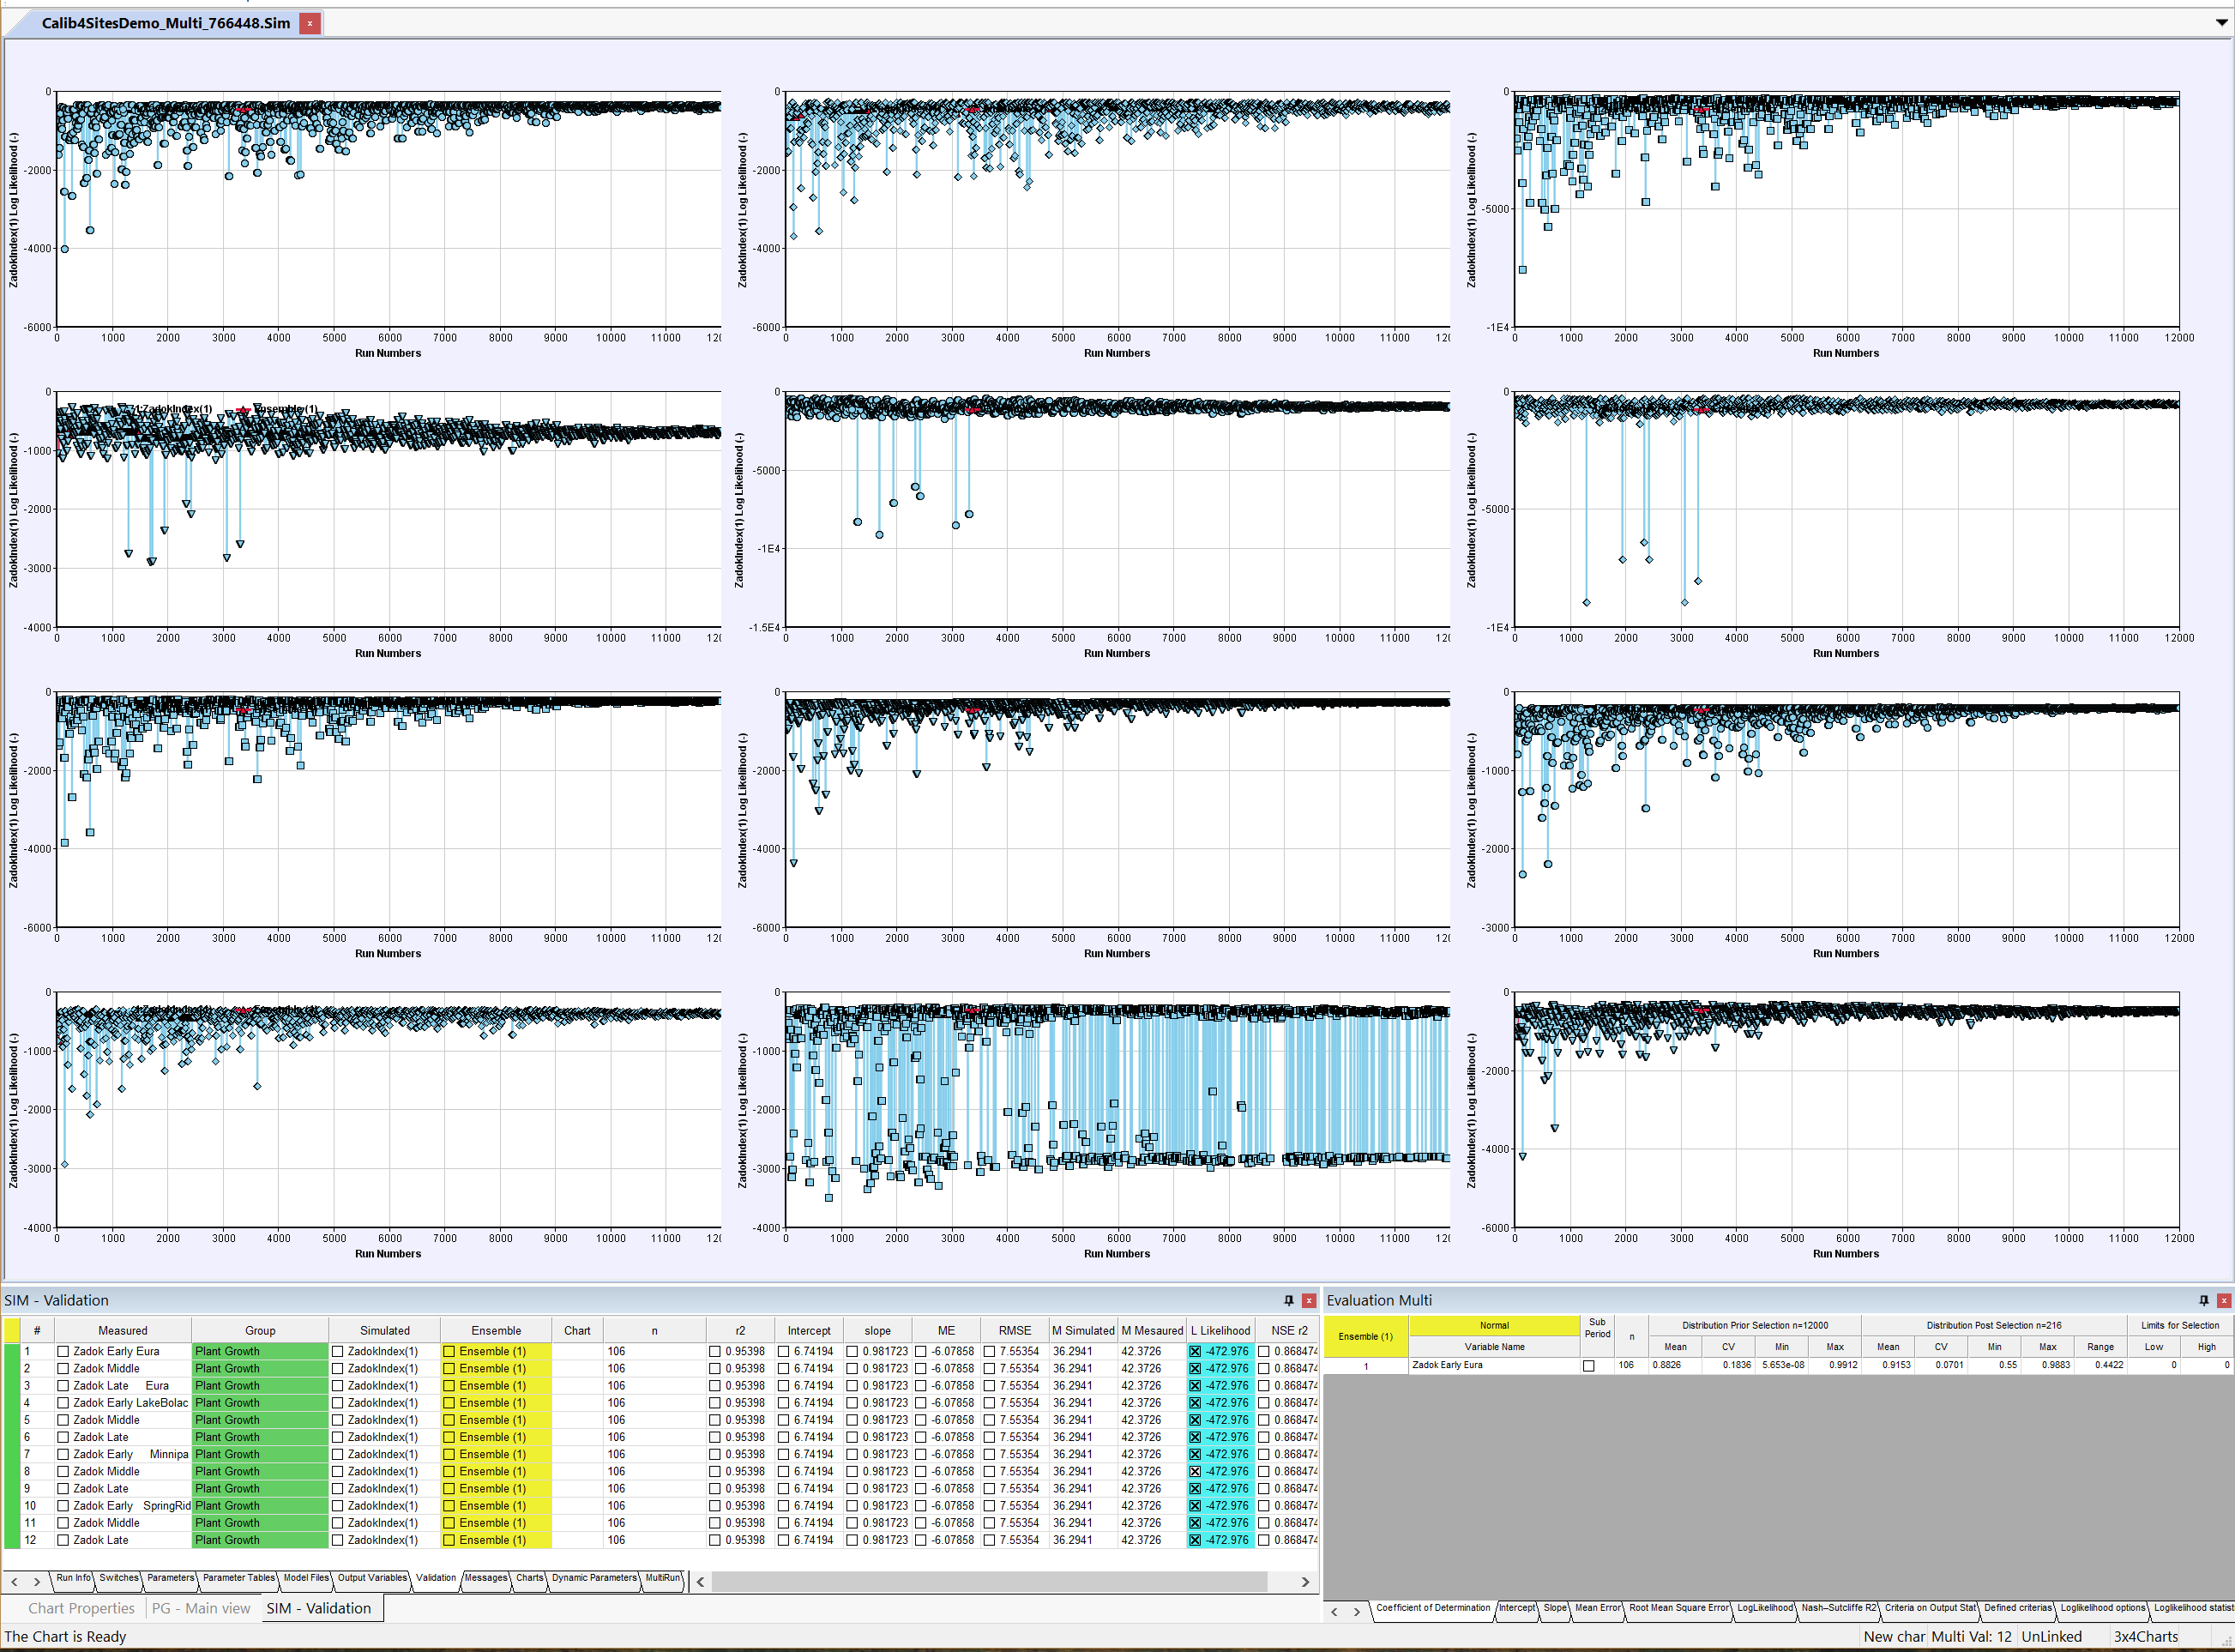
Note that the Validation Sheet has been expanded to 12 Variables and the results showing the 12 different Validation variables and the correspondent simulation variable can be made for each run.
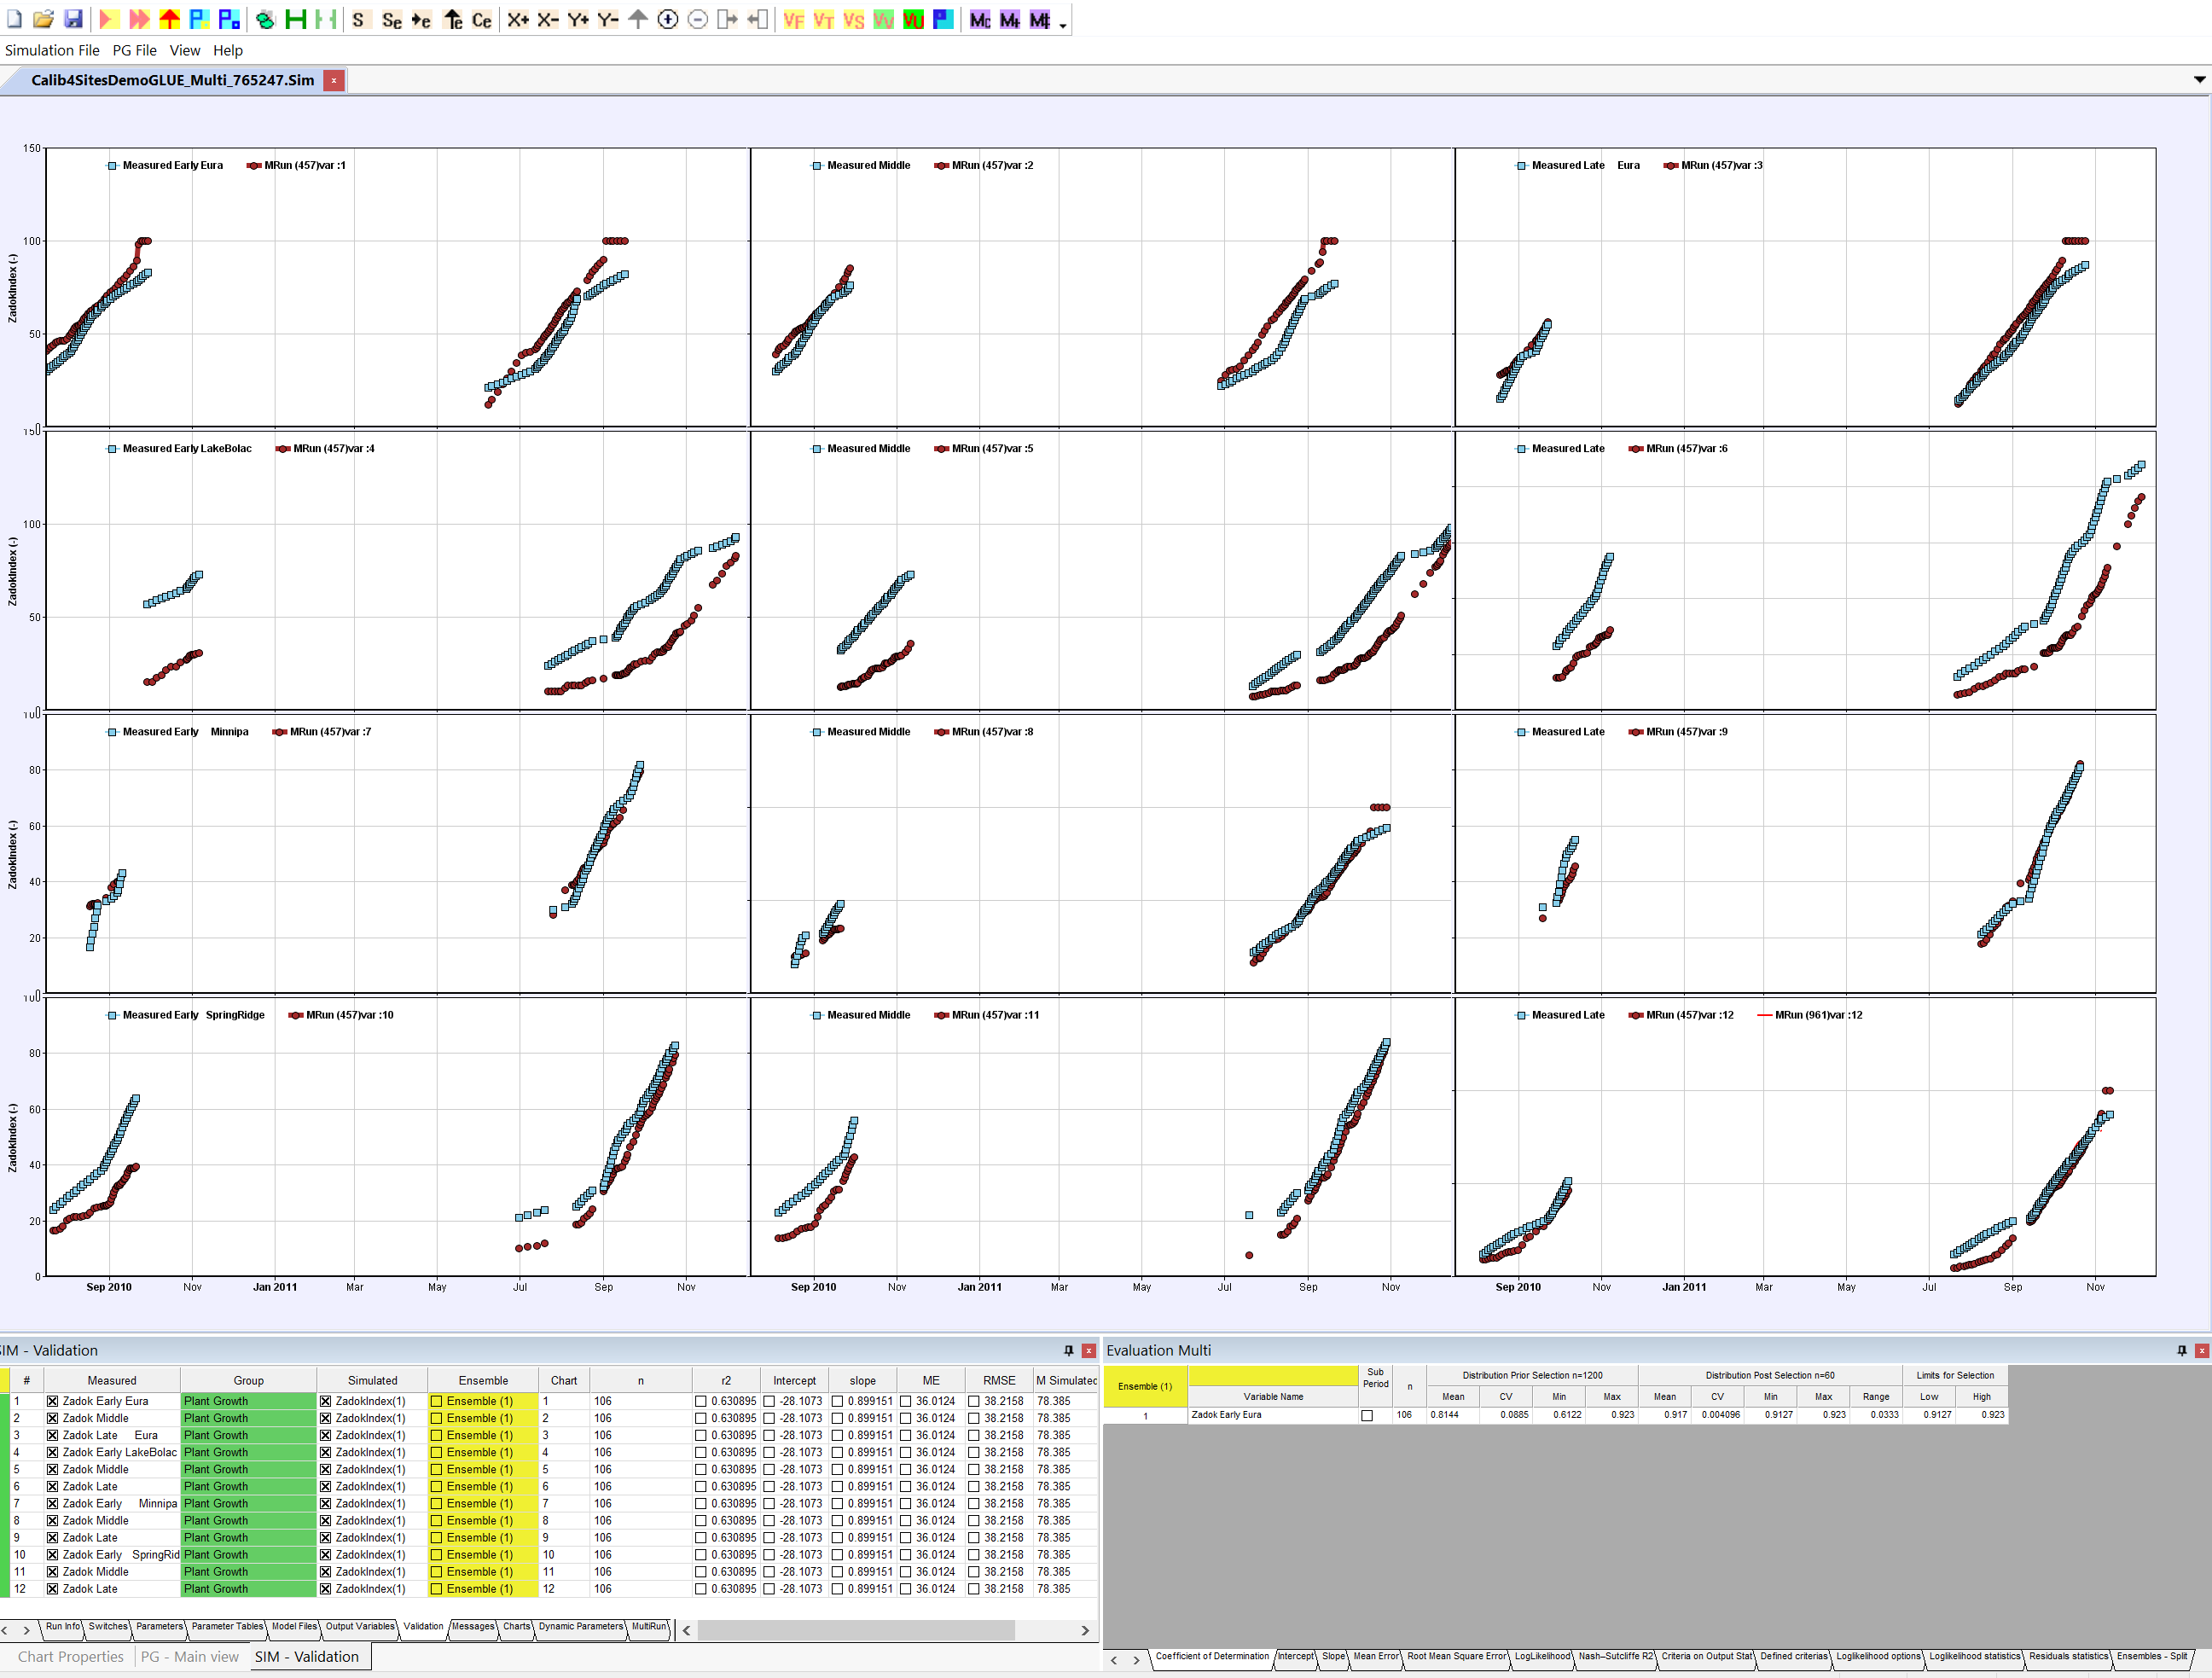
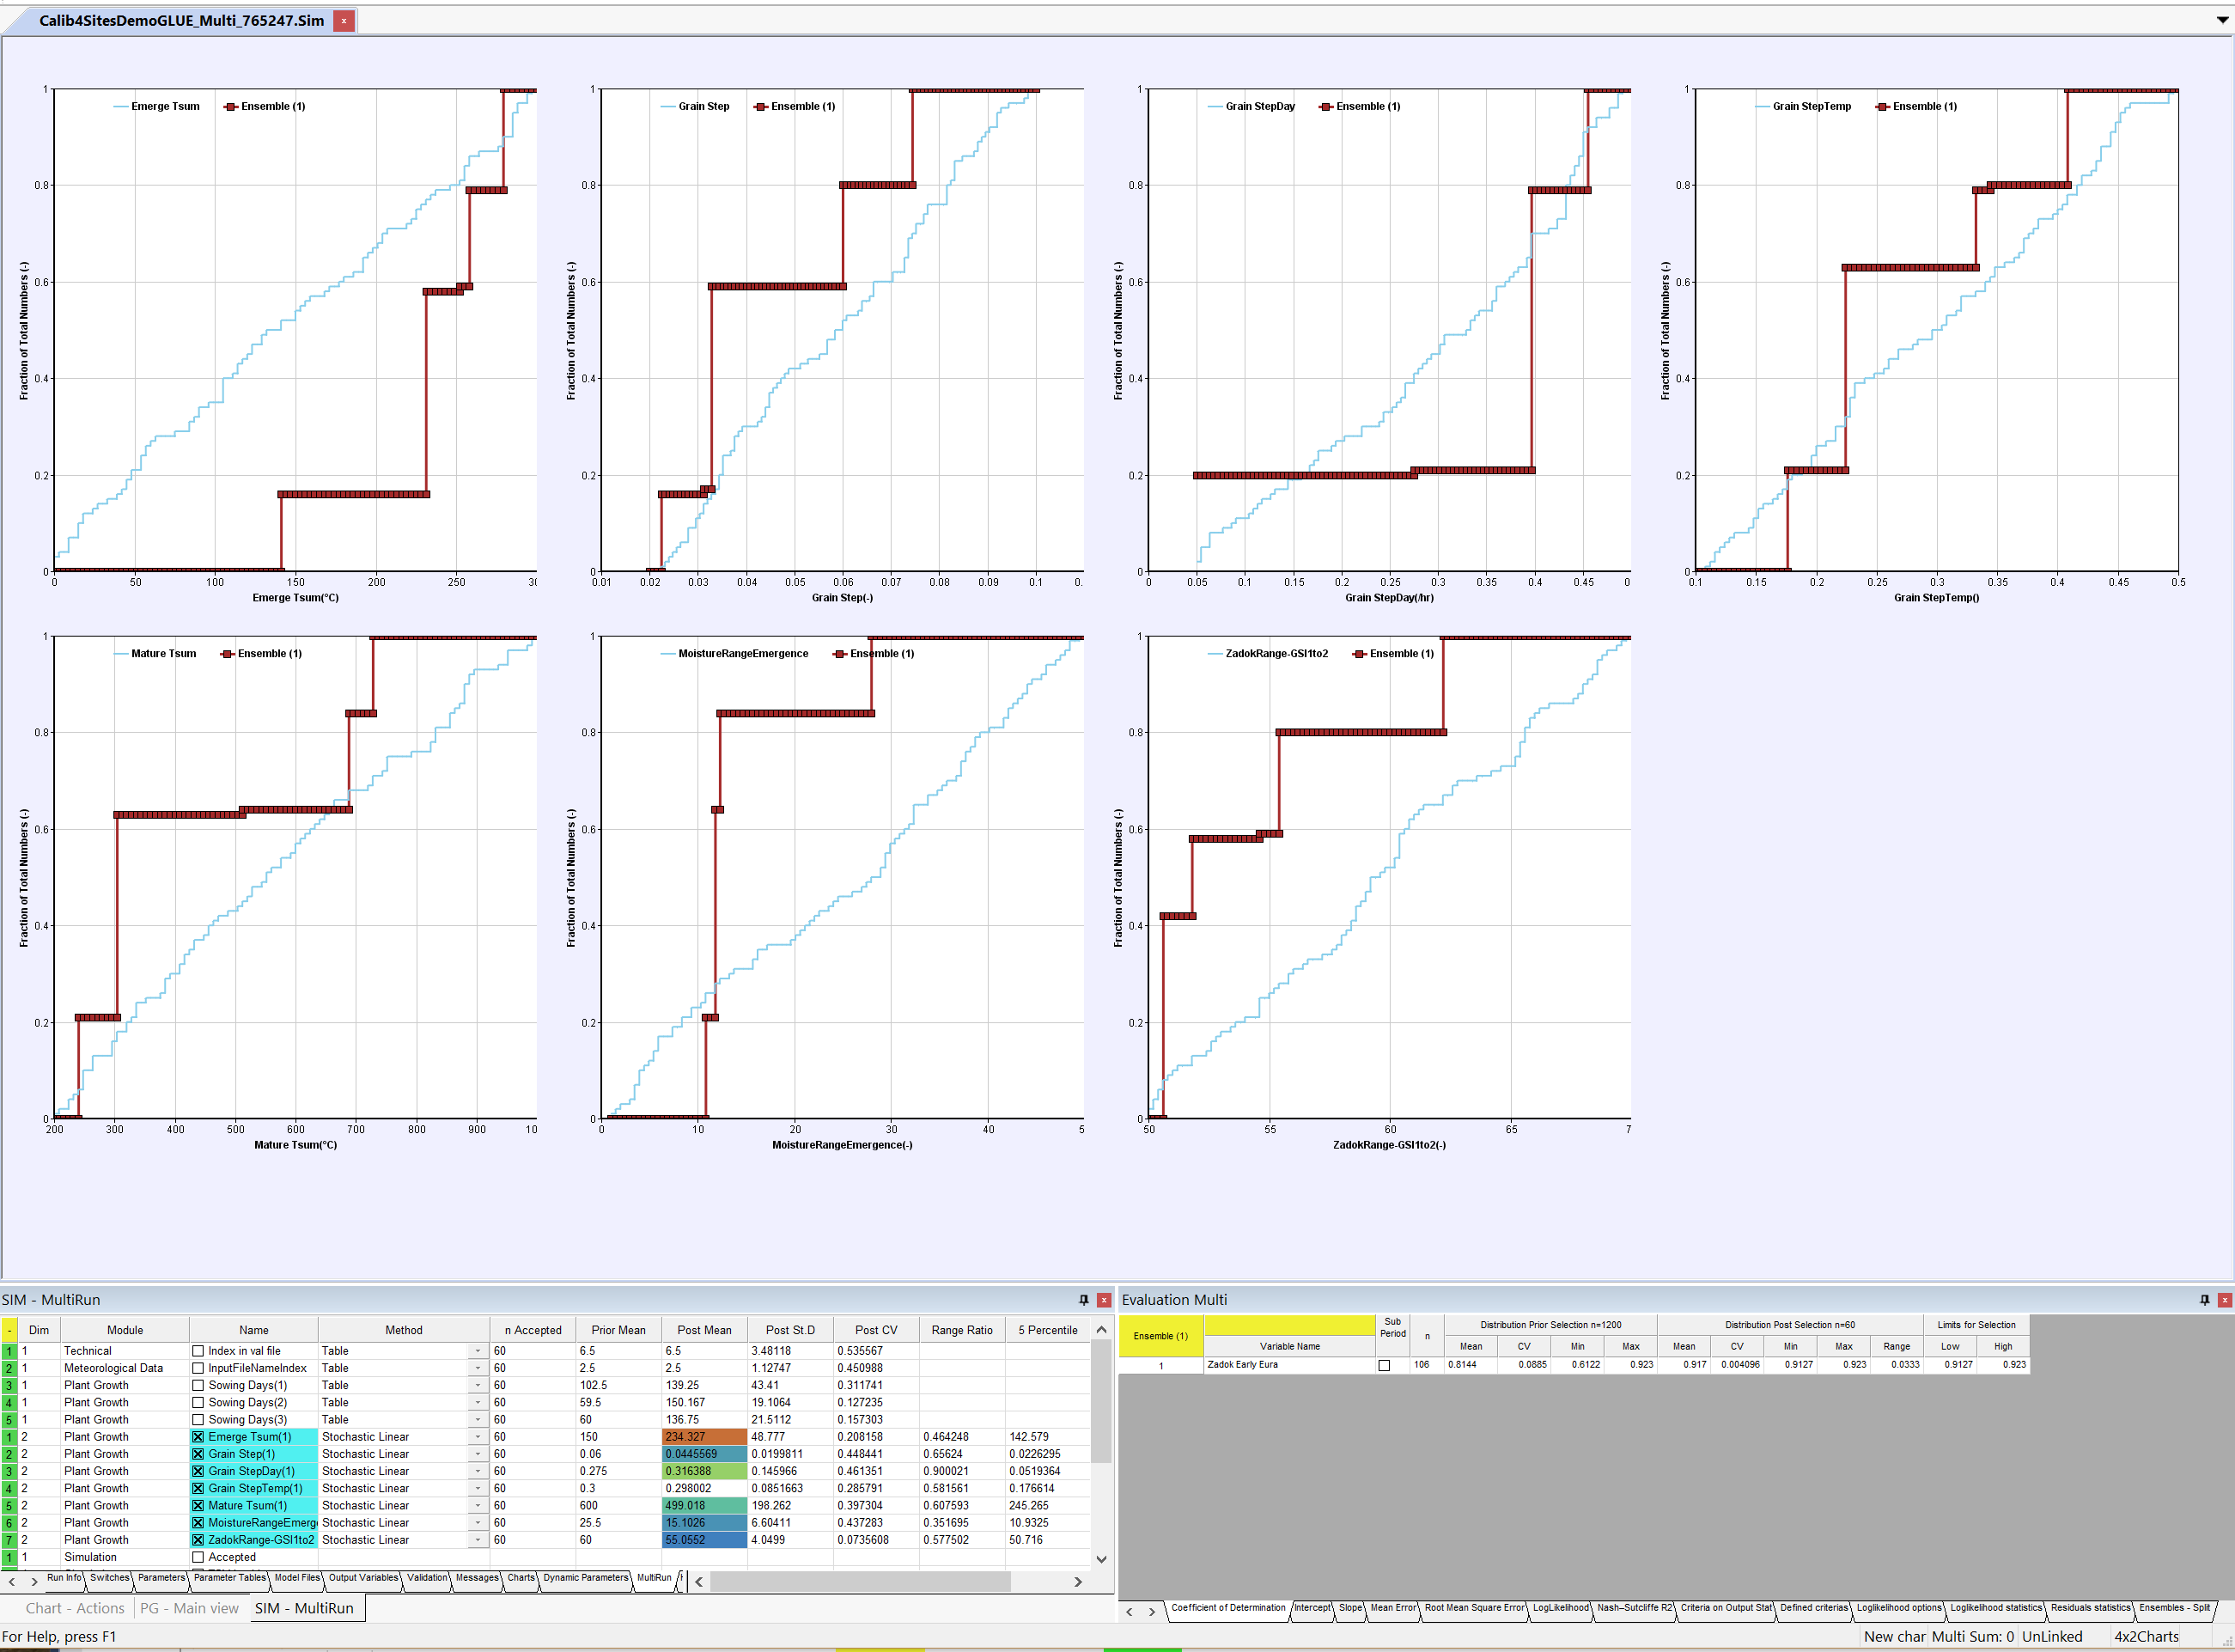
The Ensemble of the accepted run can also be compared to the measured for each site.
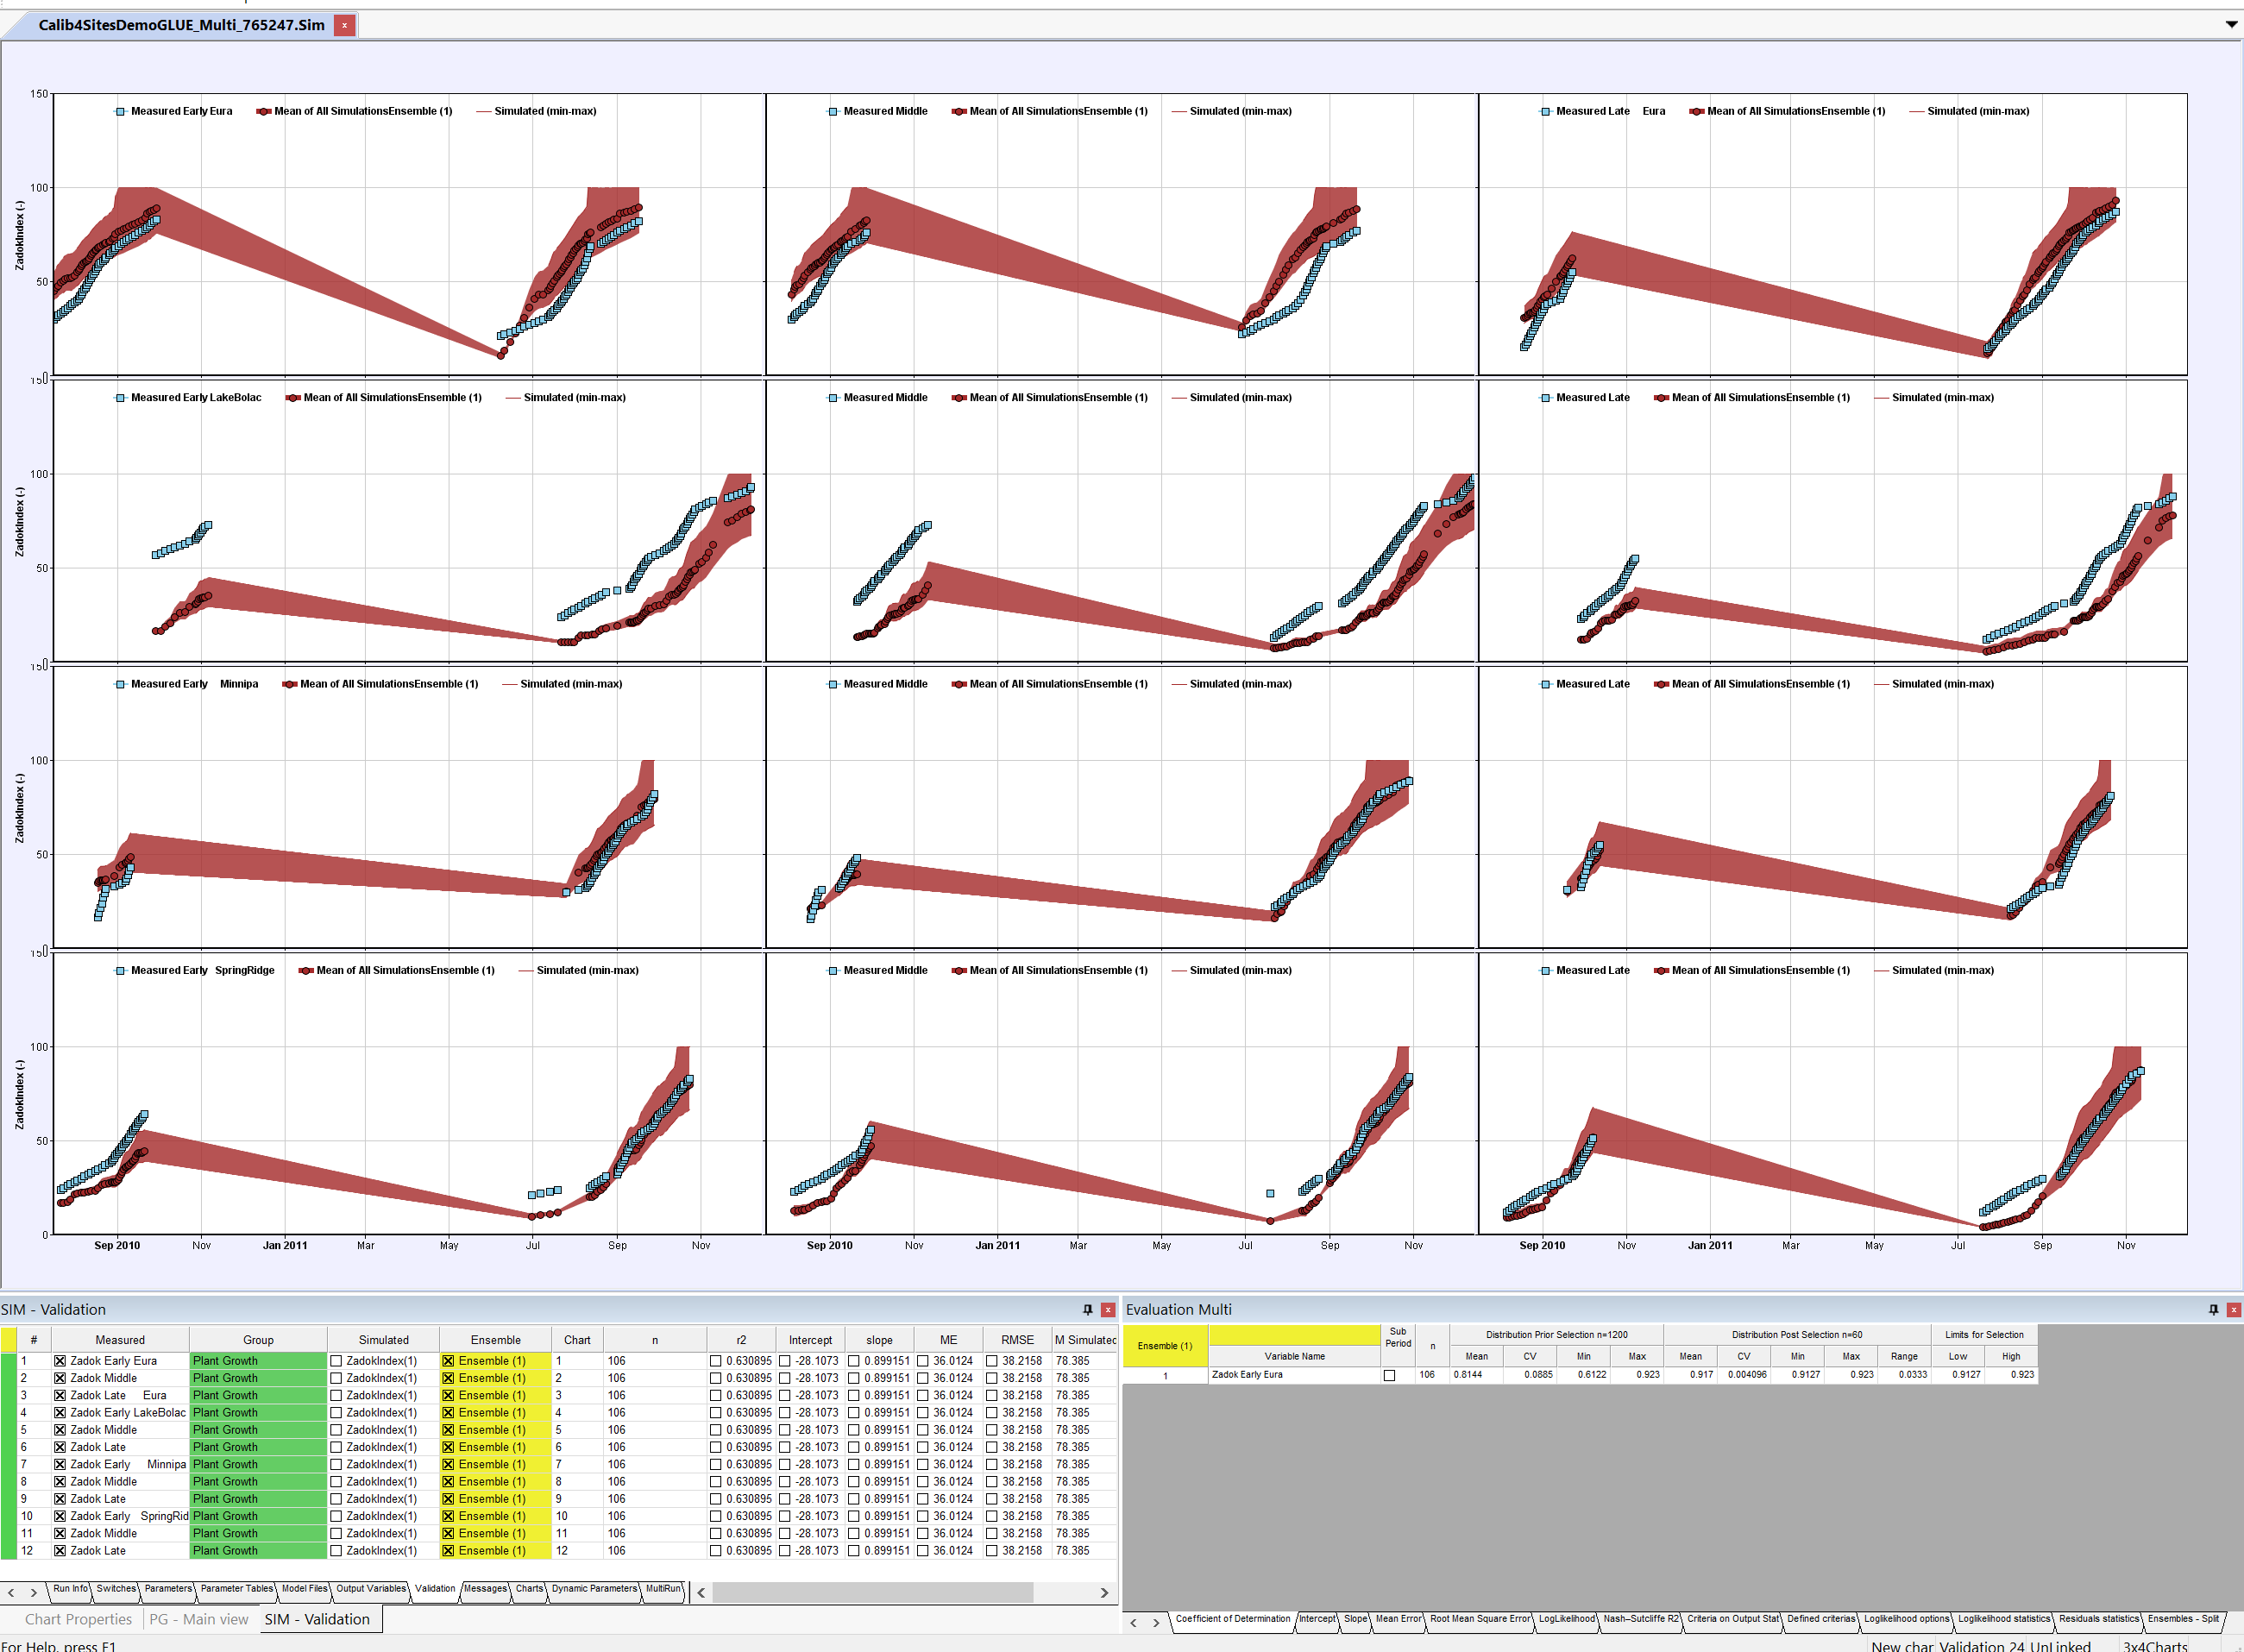
In case of a GLUE calibration only a single mean value of the performance for the runs are possible to display. This is the mean of the 12 candidates within the first dimension.
Note the line for the accepted candidates compared to the points for single runs that were not accepted.
The Correspondent final distribution of parameters are displayed in the MultiRun sheet.
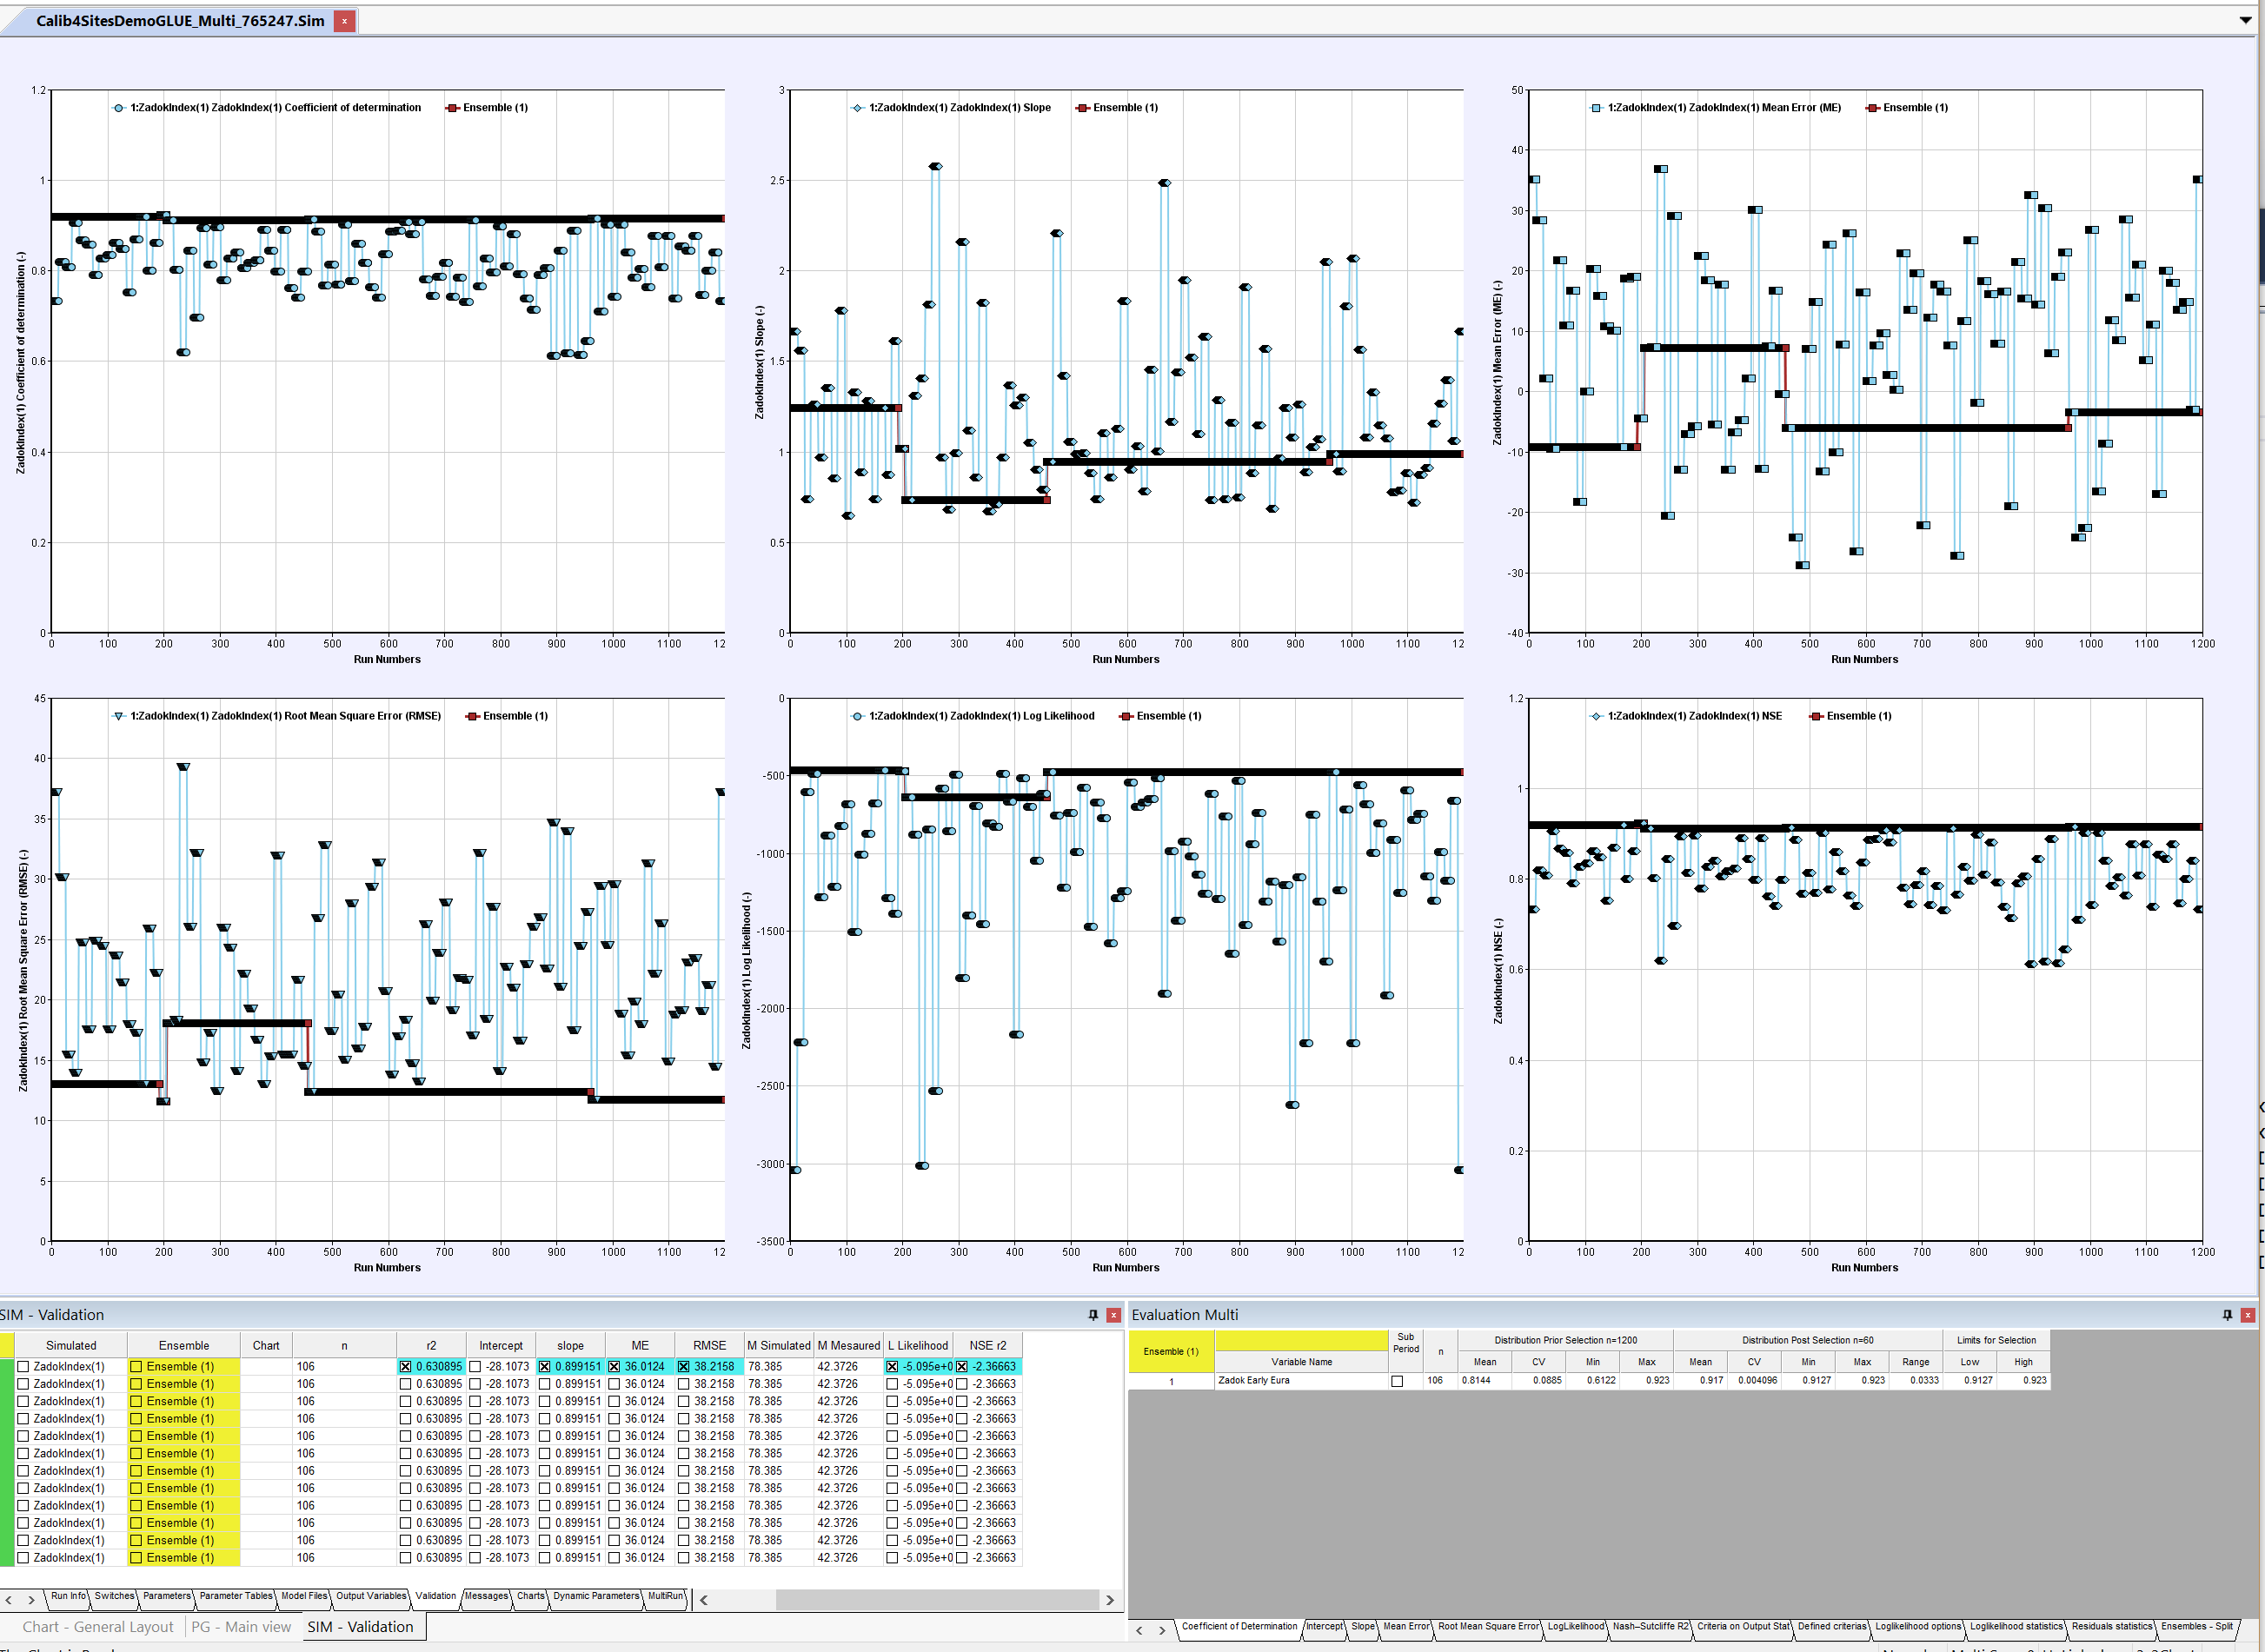
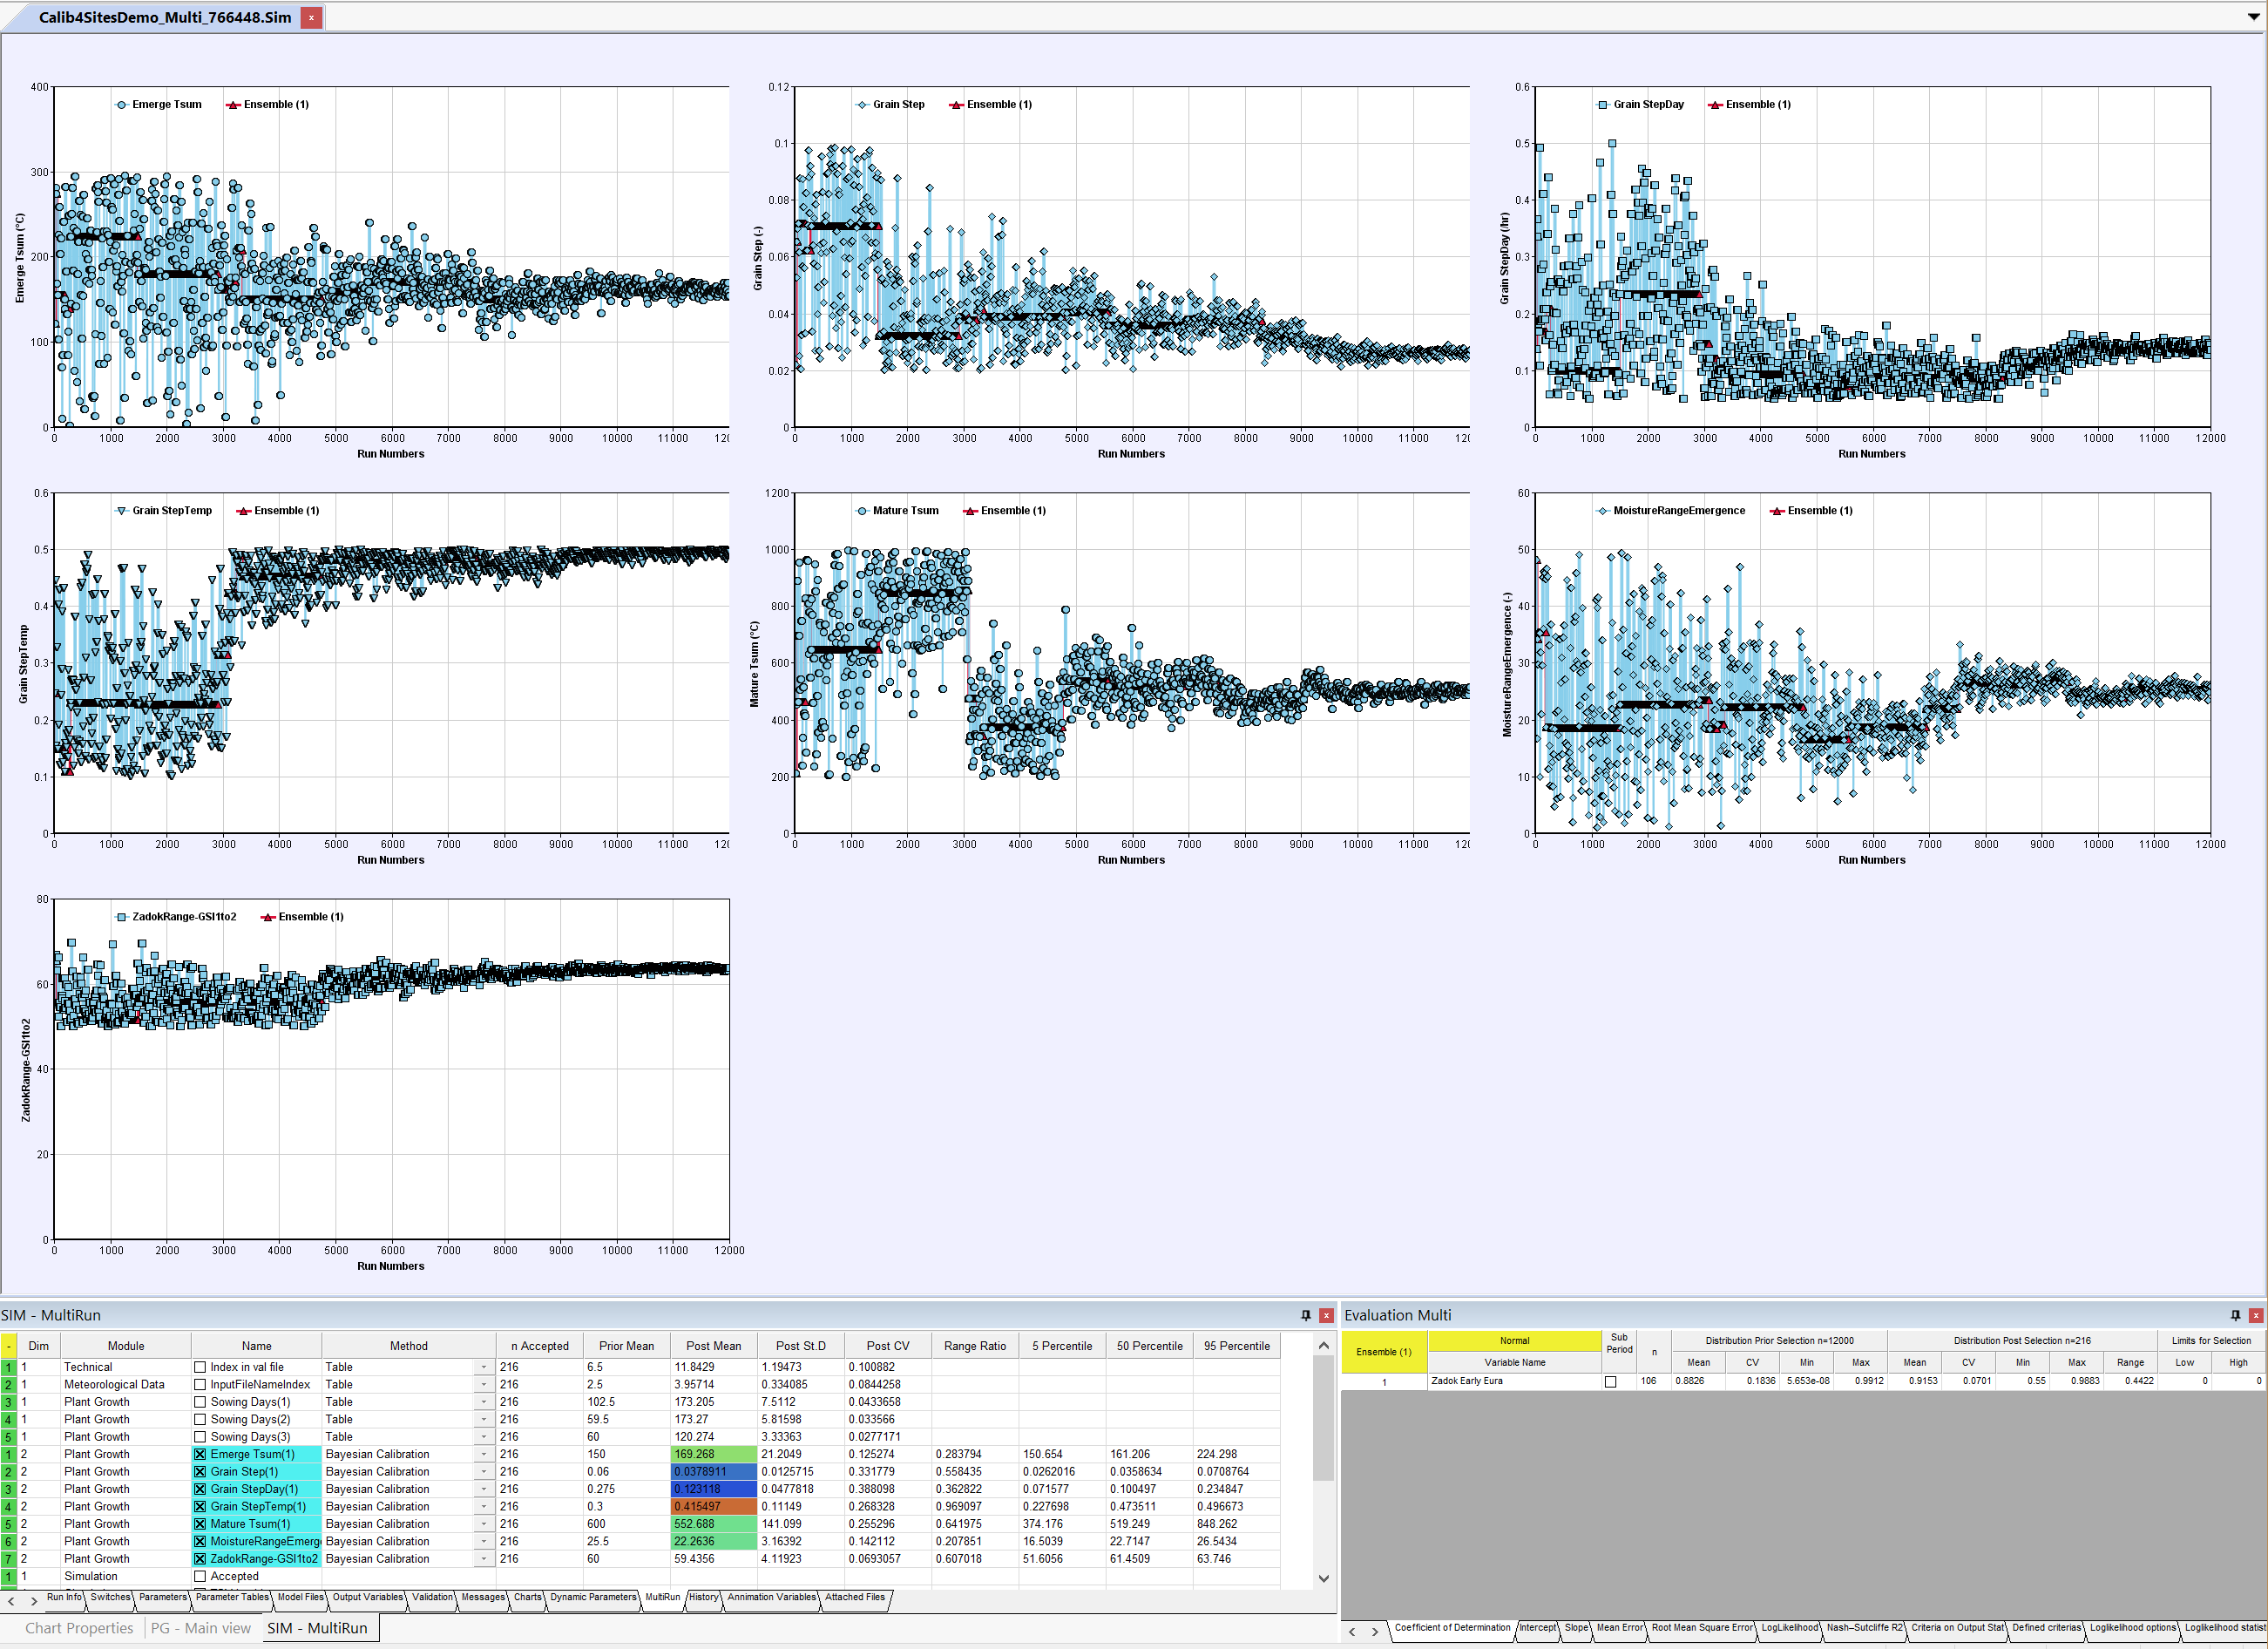
For a Bayesian approach the individual performance using convential statistical performance indicators can be viewed also for the individual runs and making it possible to see also the convergence during the calibration. Only the Sum of the LogLikelihood for each of the runs within dimension 1 were used to makethe decision on the acceptance.
For the Bayesian approach the viewing of the parameters also shows the process of convergence.
All files and the complete set of data are available to be downloaded from
https://drive.google.com/open?id=1kDLMnVL7mskjLIoZ2_cGqFj0wPa3AaTL