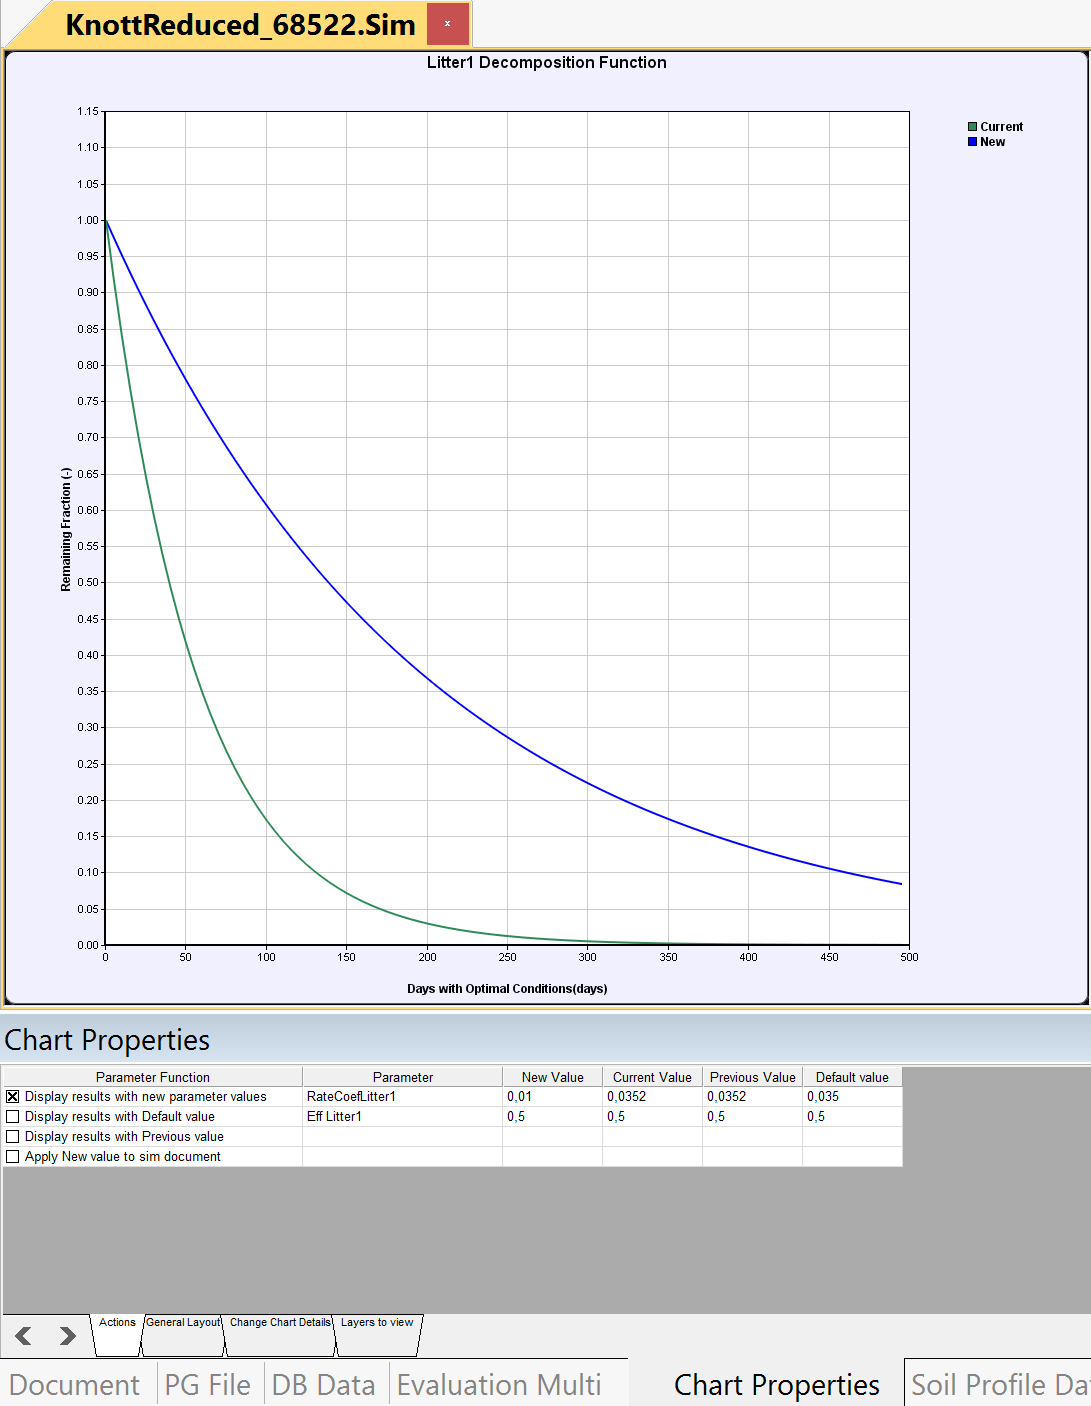
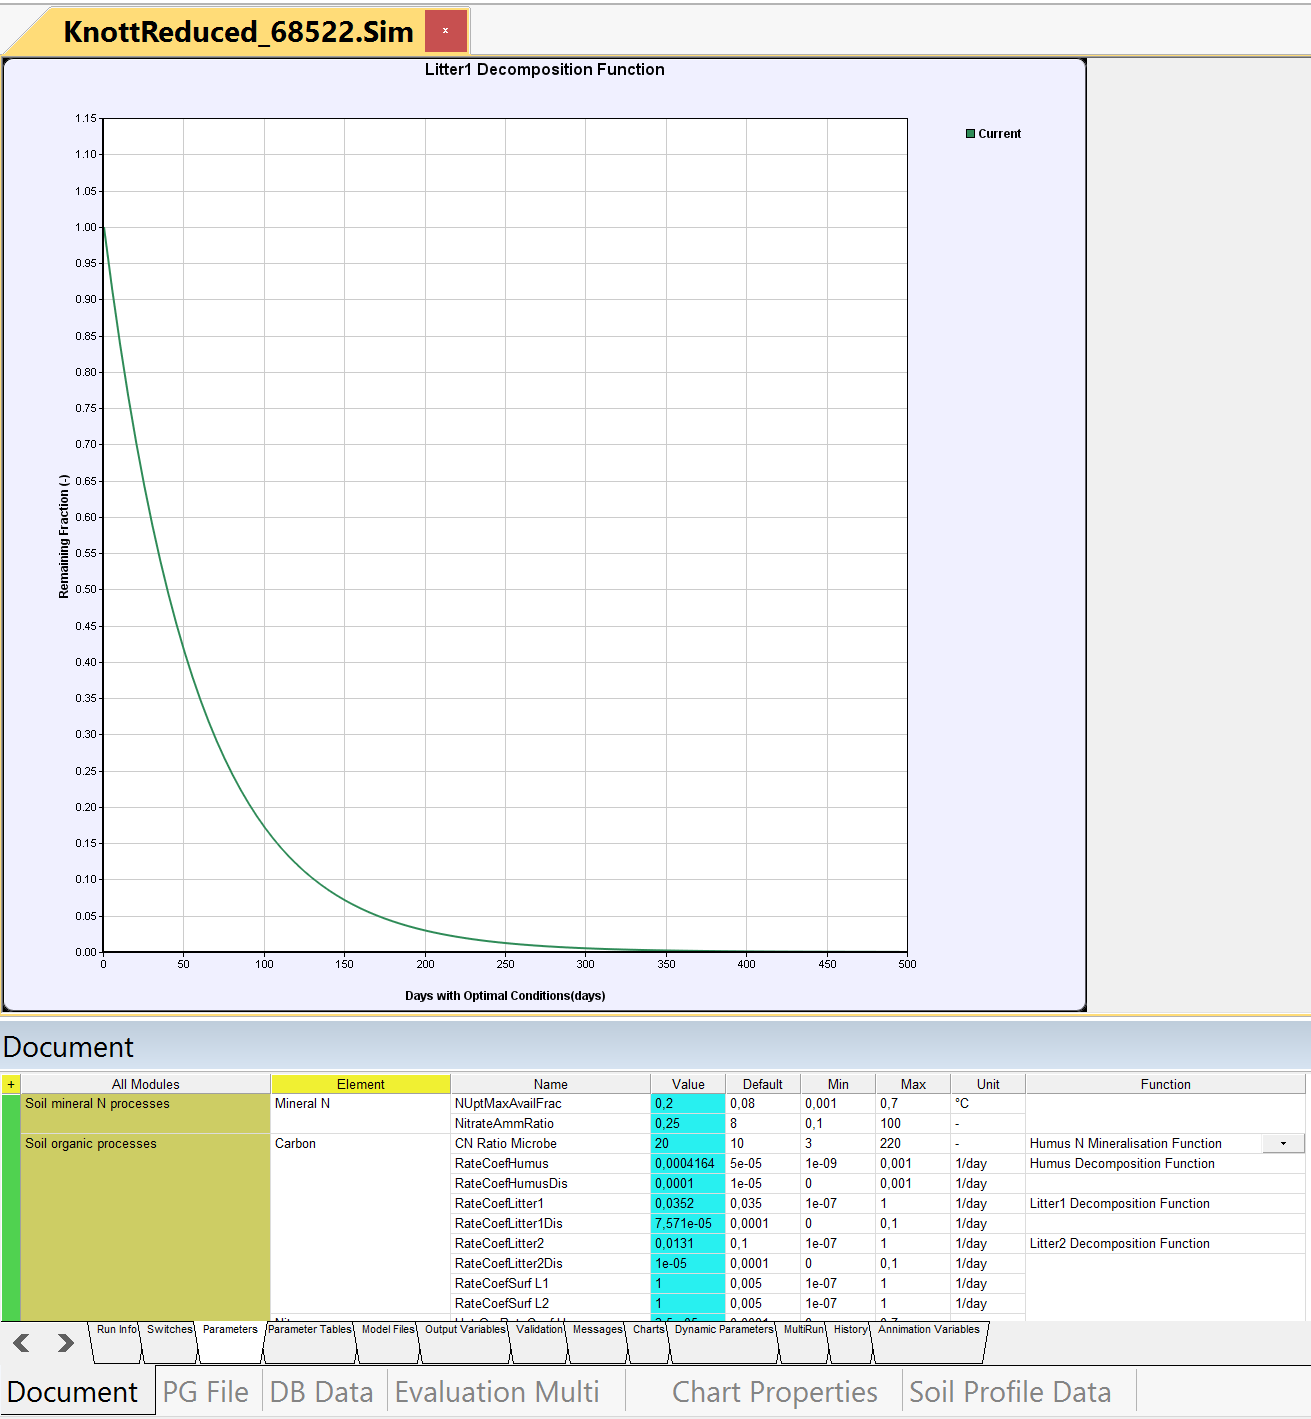
To facilitate the understanding and meaning of a number of parameters in the Plant Growth and Soil Organic modules a number of new viewing functions are implemented. Typical examples are a number of first order rate coefficients that are used to estimate the rate of flux of many variables. The default unit for those parameters are typically 1/day. The rate of loss depends on the state variables unit. The actual fluxes will be the integration during time periods that may be scaled by various response functions which make it sometime tricky to understand exactly the meaning on actual turnover rates. Also note that you can modify the scale of the independent variable.
The identification of the viewing functions from the document sheet window and the further adjustment of the viewing is using the chartproperties window. See below. Also note that the update of the new viewing functions requires that the Function.csv file is copied to the SoilProperties directory of the CoupModel Document directory. Some previous bugs with distributed Function.csv files from December last years included a number of bugs. Those are now fixed with the new current versions.